Free Lunch (36 page)
Authors: David Cay Johnston
Kay says that “the dirty little
secret” of executive pay is how government rules on golden parachutes have allowed many so-so executives to earn far more
money than the market would pay them.
A golden parachute is money an executive is
guaranteed if he is forced out for almost any reason short of being unmasked as a serial rapist. In fact, under some executive
contracts, even that might not be grounds for dismissal unless the victims had some connection to the company. The typical
parachute guarantees three years of pay and perks, which would be tens of millions of dollars for many CEOs. The three years
follows a rule set by Congress.
“Basically companies had to bribe their executives with higher
levels of pay so they would not be motivated to just get their golden parachutes” and walk away, Kay said. In contrast, Kay
remarked, rank-and-file employees “have much less power; they are not leaving very much. The baby boomers, you can basically
treat them terribly and they don't quit.”
At least one boomer who stood up and blew the whistle
on what was really happening on the top floor was rewarded for this diligence not with a golden parachute, but by being fired. For
almost three years Remy Welling stewed about what happened to her. During that time, she pored over every story she could find
about the stock-options scandal that she had been fired for bringing to light.
Among the
stories that seized her attention were extraordinary
Wall Street Journal
pieces on
stock-options abuses, for which reporters James Bandler, Charles Forelle, Mark Maremont, Gary Putka, and Steve Stecklow won
the Pulitzer Prize for Public Service.
Welling received no honors. But she did score one small
victory. Just about the time the
Journal
reporters were picking up their well-deserved
Pulitzer, Welling finally received a letter in the mail from the IRS. Inside was her enrolled agent card, which will allow her to
represent taxpayers being audited by the agency.
So what does this all mean? What is the net
effect on you of all these government policies that benefit the few at the expense of the many? Read
on.
NOT SINCE
HOOVER
The fact is that income
inequality is real; it's been rising for more than 25 years.
âPresident George W. Bush, January 31, 2007
F
OR THE RICHEST AMERICANS, THE YEARS SINCE 1980 HAVE
BEEN
very good. There were the seven fat Reagan years, as the editorial page of
The Wall Street Journal
often reminds readers, and then the even fatter Clinton years,
which those pages credit to anything but that administration. Since then, despite the collapse of the Internet bubble in 2000, which
wiped out $7 trillion of stock market wealth, the trend at the top has continued.
Remember, in
2005 the best-off 300,000 Americans had almost as much income as the bottom 150 million. It was not always so. And if we take into
account all the devicesâperfectly legal, questionable, and illegalâthat the rich use to minimize the incomes they report, it is likely
that the small group at the top has far more income than the bottom half.
There are many ways
to analyze incomes. One is to examine changes in the average income of groups. Think of a ladder, the income ladder. The poorest
Americans are at the bottom, the richest on the top rung, and everyone else stands somewhere in between. Some individuals move
up and down that ladder, but once they have been working for a few years, many find themselves settled into a section of the
ladder where they remain. The other way to examine income is to look at shares, or how the national income pie is sliced. There is a
slice for the bottom 90 percent, which we will call “the vast majority.” The other slice goes to the top 10 percent, which in 2005
basically included everyone who made more than $100,000. The top group's slice will be cut again to separate out the top 5
percent, the top 1 percent, the top tenth of 1 percent, and finally the top 1/100 of a percent, the last group comprising 30,000
Americans whose income for a single year would make anyone independently wealthy.
Let's
have dessert first.
The income pie grew a lot larger in the quarter century from 1980 to 2005. It
was like replacing a medium-size pie with a big one. As measured by what people put down on their income tax returns, the pie
grew by 79 percent, while the population increased by only a third. This means that there was more pie for everyone before slicing
it up. That makes comparing the way the pie was sliced in 1980 and in 2005 particularly interesting.
The vast majority's slice of income pie was thinner in 2005 than it had been back in 1980. That bottom 90
percent had almost two-thirds of America's income pie in 1980, but only a little more than half in 2005.
The precise numbers were calculated from tax-return data by Thomas Piketty and Emmanuel Saez, two
economists who have been studying income data around the world going back nearly a century. The vast majority received 65.3
percent of the pie in 1980, but only 51.5 percent in 2005. Not since 1928, when the vast majority received 51.7 percent of the pie, has
its share been so small.
Piketty and Saez analyzed the tax-return data based on what are
called “tax units.” That is anyone who files, or could have filed, a tax return. They excluded income transfers that are not caused by
the market economy. For example, 151 million workers paid Social Security taxes while more than 48 million had Social Security
income, a transfer their calculations ignore. Piketty and Saez count almost 145.6 million tax units, including people who did not
have to file a tax return because they were too poor or had income, such as a disability pension, not subject to tax. A single person
and a family are each counted as one unit. For simplicity we will treat each unit as having an equal share of the population. My
analysis shows that this makes for modest distortions (nitpickers, have fun), but does not alter the big picture.
The top 10 percent of Americans got more pie. A lot more. Their slice grew from more than a third to almost
half (34.6 percent in 1980 to 48.5 percent in 2005). But when we cut their slice of the pie more finely we see that this gross figure is
misleading, because the slice is not distributed at all evenly among the top 30 million Americans.
For the bottom half of the top 10 percent, the slice of pie was unchanged (11.5 percent in 1980 and 11.4
percent in 2005). For the next group, those standing between the ninety-fifth and ninety-ninth rungs on the income ladder, the slice
of pie grew somewhat. It increased from 13.2 percent to 15.3 percent.
It is when we start
looking closely at the top 1 percent that things get really interesting. Their share of the income pie more than doubled, from 10
percent to 21.8 percent. Numerically this group is three million Americans, but in terms of how much money they make it is hardly a
cohesive group. To get into the top 1 percent required an income in 2005 of $348,400. At the very top, several people made more
than a billion dollars. It would take someone at the threshold of the top 1 percent nearly 3,000 years to make a billion dollars. So, we
will cut this slice of income pie even more finely.
First, there is the top tenth of 1 percent, or
300,000 Americans. People in this group lived alone or in families with an income of at least $1.7 million for 2005. Their slice of pie
more than tripled in size. They earned 3.4 percent of the 1980 pie and 10.9 percent of the 2005 income pie.
Then, let's consider the very best off, the 30,000 Americans, or 14,588 tax units, who made at least $9.5 million
in 2005. Their slice of income pie in 2005 was four times larger than in 1980. They went from almost 1.3 percent of the pie in 1980 to
a tad more than 5 percent in 2005.
The Rich Get a Bigger
Slice
SHARE OF INCOME REPORTED ON TAX
RETURNS
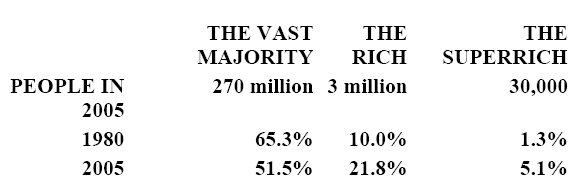
Source: Piketty and
Saez
So the vast majority had less pie in 2005 than in
1980. And even among the top 10 percent with their larger slice, nearly all of the growth went to the top 1 percentâespecially those
at the very top who were already very rich, yet whose slice of pie grew even fatter.
Put another
way, the rich enjoyed their biggest slice of the national income pie since Herbert Hoover was president. Indeed, their income share
was virtually the same as in 1928 and 1929, the last of the Roaring Twenties and just ahead of the Terrible Thirties.
President Kennedy famously said that a rising tide lifts all boats. If a rising tide of income makes everyone
better off, then changes in the shares people get do not matter so much. But that is not what is happening. Instead, as the numbers
for average incomes show, the yachts are becoming personal ocean liners while the runabouts and dinghies, tied to the dock, are
being swamped.
The national economy, adjusted for inflation, more than doubled in size from
1980 to 2005. However, because the population grew by a third during those years, the growth per person was only about
two-thirds. That is, for each dollar per person that the economy produced in 1980, by 2006 output had grown to about $1.67. So
what happens when we look at the income ladder?
The average income of the vast majority
dipped slightly, from $29,495 in 1980 to $29,143 in 2005. The decline is about a dollar a day. So while the overall economy did quite
well, the vast majority did not share in that prosperity. Moreover, if we reach back a bit further we find that the decline in income for
the vast majority is actually quite severe.
The average income for the bottom 90 percent of
Americans peaked in 1973 at $33,001. That is nearly $4,000 more per year than this group's average income in 2005. So after a
generation of economic growth, over 32 years, the vast majority has to get by on about $75 less per week.
The declines are even greater if we examine the bottom half of the income ladder, which in 2005 was 150
million Americans. Piketty and Saez did not prepare such a breakdown. But the Tax Foundation, a group that favors less taxation,
did. Its data cover only 1980 through 2004, but not having data from 2005 does not change the big picture.
Adjusted for inflation, the bottom half had an average income of $15,464 in 1980. That fell to $14,149 in 2004.
That meant making ends meet with $25 less per week than in 1980.
There have been some
offsetting changes. The portion of income paid in federal income taxes by the bottom 150 million Americans has been cut in half,
the Tax Foundation calculated. Back in 1980 their average tax rate was a bit more than 6 percent, while in 2004 it was just under 3
percent. That means the after-tax decline in income was only $15 a week, not $25.
Things were
a little different at the top of the ladder. For starters, to reach the ninetieth rung required $100,714 in 2005, up from $84,080 in 1980,
Piketty and Saez calculated. That meant someone who was at the ninetieth rung in 1980 had to get an annual raise, after adjusting
for inflation, of only $665 each year just to stay in place.
The higher one stood on the ladder
above that, the more it took to stay in place. The threshold to be in the top 1 percent rose in tandem with the economy. Gross
National Product per capita grew 67 percent, compared with a 71 percent increase in the threshold for the ninety-ninth rung on the
income ladder.
To reach the top tenth of a percent, however, required increasing income since
1980 by slightly more than a million dollars, to more than $1.7 million in 2005. And for the very top, the best-off 1/100 of 1 percent,
the threshold rose from $2.5 million to $9.5 million. Looking at the average income of that top group provides an even more startling
figure. Their average income was $5.2 million in 1980, but more than $25.7 million in 2005. Remember that increase in annual
income, $20.5 million, is
after
adjusting for inflation.
The pattern here is clear. The rich are getting fabulously richer, the vast majority are somewhat worse off, and
the bottom halfâfor all practical purposes, the poorâare being savaged by our current economic policies.
Incomes Rose Only at the Top
AVERAGE ANNUAL
INCOME
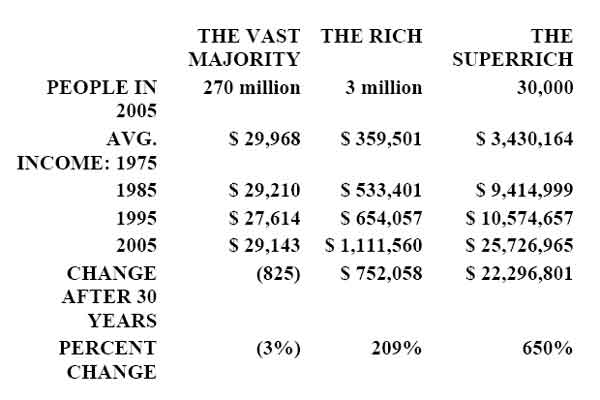
Source: Piketty and Saez
That those at the top have
been pulling away from everyone else in the past three decades is now so long established, so visible across many different
measures of income, and so well analyzed that it is accepted by everyone who has examined the data, save for a few ideological
crackpots at some of the ideology-marketing organizations that pose as think tanks. Even President Bush, a man who has joked
about how closely he is identified with what he called “the haves and have mores,” sees this growing divide as a problem. “I know
some of our citizens worry about the fact that our dynamic economy is leaving working people behind,” he said early in 2007. “We
have an obligation to help ensure that every citizen shares in this country's future.”
To
appreciate fully how much the fruits of economic growth are, under current government policies, being concentrated in the hands
of the few, it is useful to perform another kind of analysis. We will examine the ratio of income growth between different groups
over several long periods of time, starting with a comparison between the lower 90 percent, our “vast majority,” and the top 1
percent.
Let's consider three eras. The first would be from 1950 to 1975, a quarter century
when a rising tide did lift all boats and the nation was transformed into a land of broad prosperity. Setting the second era from 1960
to 1985 allows us to incorporate an early part of the era in which government began changing its policies in ways favored by many
of the rich. Finally, it would be good to compare 1980 with 2005, but that will not work mathematically because the ratio would
include negative numbers, since the income of the vast majority declined slightly. So instead we will use 1981, a recession year, to
compare to 2005. The vast majority's average annual income was $114 higher at the end of those 24 years.