Pro Oracle Database 11g Administration (101 page)
In this example, you’ll enter 25922. Here is the output:
'USERNAME:'||S.USERNAME||CHR(10)||'OSUSER:'||S.OSUSER||CHR(10)||'PROGRAM:'||S.PR
--------------------------------------------------------------------------------
USERNAME : SYS
OSUSER : mscd642
PROGRAM : [email protected] (TNS V1-V3)
SPID : 25922
SID : 139
SERIAL# : 90
MACHINE : ora04.regis.local
TERMINAL : pts/9
608
CHAPTER 22 ■ DATABASE TROUBLESHOOTING
In this output, the PROGRAM value is [email protected]. This indicates that a SQL*Plus session is the program consuming the inordinate amount of resources on the server. Next, run the following query to display the SQL statement associated with the operating system process ID (in this example, the SPID is 25922):
select
'USERNAME : ' || s.username || chr(10) ||
'OSUSER : ' || s.osuser || chr(10) ||
'PROGRAM : ' || s.program || chr(10) ||
'SPID : ' || p.spid || chr(10) ||
'SID : ' || s.sid || chr(10) ||
'SERIAL# : ' || s.serial# || chr(10) ||
'MACHINE : ' || s.machine || chr(10) ||
'TERMINAL : ' || s.terminal || chr(10) ||
'SQL TEXT : ' || q.sql_text
from v$session s
,v$process p
,v$sql q
where s.paddr = p.addr
and p.spid = '&PID_FROM_OS'
and s.sql_id = q.sql_id;
The result shows the resource-consuming SQL as part of the output in the SQL TEXT column:
'USERNAME:'||S.USERNAME||CHR(10)||'OSUSER:'||S.OSUSER||CHR(10)||'PROGRAM:'||S.PR
--------------------------------------------------------------------------------
USERNAME : SYS
OSUSER : mscd642
PROGRAM : [email protected] (TNS V1-V3)
SPID : 25922
SID : 139
SERIAL# : 90
MACHINE : ora04.regis.local
TERMINAL : pts/9
SQL TEXT : select a.table_name from dba_tables a,dba_indexes,dba_constraints uni When you run multiple databases on one server and are experiencing server performance issues, it can sometimes be difficult to pinpoint which database and associated process are causing the problems.
In these situations, you have to use an operating system tool to identify the top-consuming sessions on the system.
In a Linux or Unix environment, you can use utilities such as ps, top, or vmstat to identify top-consuming operating system processes. The ps utility is handy because it lets you identify processes consuming the most CPU or memory. The previous ps command identified the top consuming CPU
processes. Here, it’s used it to identify the top Oracle memory-using processes: $ ps -e -o pmem,pid,user,tty,args | grep -i oracle | sort -n -k 1 -r | head Once you have identified a top-consuming process associated with a database, you can query the data dictionary views based on the server process ID to identify what the database process is executing.
609
CHAPTER 22 ■ DATABASE TROUBLESHOOTING
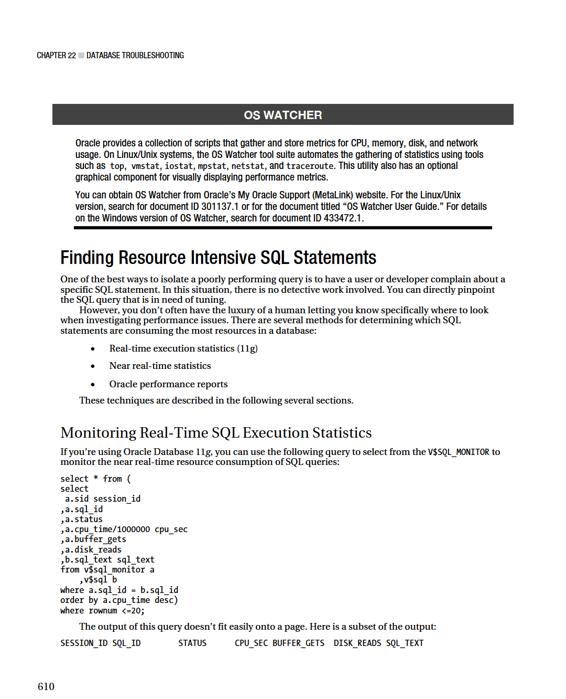
---------- ------------- --------- ---------- ----------- ---------- ---------------
139 d07nngmx93rq7 DONE 331.88 5708 3490 select count(*) 130 9dtu8zn9yy4uc EXECUTING 11.55 5710 248 select task_name In the query, an inline view is utilized to first retrieve all records and organize them by CPU_TIME in descending order. The outer query then limits the result set to the top twenty rows using the ROWNUM
pseudocolumn. You can modify the previous query to order by the statistic of your choice or modify it to display only the queries that are currently executing. For example, the next SQL statement monitors currently executing queries ordered by the number of disk reads:
select * from (
select
a.sid session_id
,a.sql_id
,a.status
,a.cpu_time/1000000 cpu_sec
,a.buffer_gets
,a.disk_reads
,substr(b.sql_text,1,15) sql_text
from v$sql_monitor a
,v$sql b
where a.sql_id = b.sql_id
and a.status='EXECUTING'
order by a.disk_reads desc)
where rownum <=20;
The statistics in V$SQL_MONITOR are updated every second so you can view resource consumption as it changes. These statistics are gathered by default if a SQL statement runs in parallel or consumes more than 5 seconds of CPU or I/O time.
The V$SQL_MONITOR view includes a subset of statistics contained in the V$SQL, V$SQLAREA, and V$SQLSTATS views. The V$SQL_MONITOR view displays real-time statistics for each execution of a resource-intensive SQL statement, whereas V$SQL, V$SQLAREA, and V$SQLSTATATS contain cumulative sets of statistics over several executions of a SQL statement.
Once the SQL statement execution ends, the run time statistics are not immediately flushed from V$SQL_MONITOR. Depending on activity in your database, the statistics can be available for some period of time. If you have a very active database, the statistics could potentially be flushed soon after the query finishes.
■
Tip
You can uniquely identify an execution of a SQL statement in V$SQL_MONITOR from a combination of the following columns: SQL_ID, SQL_EXEC_START, SQL_EXEC_ID.
Displaying Resource Intensive SQL
As mentioned in the prior section, the V$SQL_MONITOR view is available with Oracle Database 11g or higher. If you're using an older version of Oracle, you can query views like V$SQLSTATS to determine which SQL statements are consuming inordinate amounts of resources. For example, use the following query to identify the ten most resource-intensive queries based on CPU time: 611
CHAPTER 22 ■ DATABASE TROUBLESHOOTING
select * from(
select
sql_text
,buffer_gets
,disk_reads
,sorts
,cpu_time/1000000 cpu_sec
,executions
,rows_processed
from v$sqlstats
order by cpu_time DESC)
where rownum < 11;
In the prior query, an inline view is utilized to first retrieve all records and sorts the output by CPU_TIME in descending order. The outer query then limits the result set to the top ten rows using the ROWNUM pseudocolumn. The query can be easily modified to sort by a column other than CPU_TIME. For example, if you want to report resource usage by BUFFER_GETS, simply change the ORDER BY clause to use BUFFER_GETS instead of CPU_TIME. The CPU_TIME column is calculated in microseconds; to convert it to seconds, divided it by 1000000.
The V$SQLSTATS view displays performance statistics for SQL statements that have recently executed.
You can also use V$SQL and V$SQLAREA to report on SQL resource usage. V$SQLSTATS is faster and retains information for a longer period of time, but contains only a subset of the columns in V$SQL and V$SQLAREA. Thus, there are scenarios where you may want to query from V$SQL or V$SQLAREA. For example, if you want to display information such as the user who first parsed the query, use the PARSING_USER_ID column of V$SQLAREA:
select * from(
select
b.sql_text
,a.username
,b.buffer_gets
,b.disk_reads
,b.sorts
,b.cpu_time/1000000 cpu_sec
from v$sqlarea b
,dba_users a
where b.parsing_user_id = a.user_id
order by b.cpu_time DESC)
where rownum < 11;
Running Oracle Diagnostic Utilities
Oracle provides several utilities for diagnosing database performance issues:
• Automatic Workload Repository (AWR)
• Automatic Database Diagnostic Monitor (ADDM)
• Active Session History (ASH)
• Statspack
612
CHAPTER 22 ■ DATABASE TROUBLESHOOTING
AWR, ADDM, and ASH were introduced in Oracle Database 10
g
. These tools provide advanced reporting capabilities that allow you to troubleshoot and resolve performance issues. These new utilities require an extra license from Oracle. The older Statspack utility is free and requires no license.
All of these tools rely heavily on the underlying V$ dynamic performance views. Oracle maintains a vast collection of these views that track and accumulate metrics of database performance. For example, if you run the following query, you’ll notice that for Oracle Database 11
g
release 2, there are 600 or so V$
views:
SQL> select count(*) from dictionary where table_name like 'V$%';
COUNT(*)
----------
600
The Oracle performance utilities rely on periodic snapshots gathered from these internal performance views. Two of the most useful views with regard to performance statistics are the V$SYSSTAT
and V$SESSTAT views. The V$SYSSTAT view contains over 400 types of database statistics. This V$SYSSTAT
view contains information about the entire database, whereas the V$SESSTAT view contains statistics for individual sessions. A few of the values in the V$SYSSTAT and V$SESSTAT views contain the current usage of the resource. These values are:
• opened cursors current
• logons current
• session cursor cache current
• work area memory allocated
The rest of the values are cumulative. The values in V$SYSSTAT are cumulative for the entire database from the time the instance was started. The values in V$SESSTAT are cumulative per session from the time the session was started. Some of the more important performance-related cumulative values are:
• CPU used
• consistent gets
• physical reads
• physical writes
For the cumulative statistics, the way to measure periodic usage is to note the value of a statistic at a starting point, then note the value at a later point in time, and capture the delta. This is the approach used by the Oracle performance utilities such as AWR and Statspack. Periodically, Oracle will take a snapshot of the dynamic wait interface views and store them in a repository.
The following sections in this chapter detail how access AWR, ADDM, ASH, and Statspack from SQL*Plus.
■
Tip
You can access AWR, ADDM, and ASH from Enterprise Manager. You may find the Enterprise Manager screens more intuitive and efficient than using SQL*Plus.
613
CHAPTER 22 ■ DATABASE TROUBLESHOOTING
Using AWR
An AWR report is good for viewing the entire system performance and identifying the top resource-consuming SQL queries. Run the following script to generate an AWR report: SQL> @?/rdbms/admin/awrrpt
From the AWR output, identify top resource-consuming statements in the “SQL ordered by Elapsed Time” or the “SQL ordered by CPU Time” sections of the report. Here is some sample output: SQL ordered by CPU Time DB/Inst: DWREP/DWREP Snaps: 11384-11407
-> Resources reported for PL/SQL code includes the resources used by all SQL
statements called by the code.
-> % Total DB Time is the Elapsed Time of the SQL statement divided into the Total Database Time multiplied by 100
CPU Elapsed CPU per % Total
Time (s) Time (s) Executions Exec (s) DB Time SQL Id
---------- ---------- ------------ ----------- ------- -------------
4,809 13,731 10 480.86 6.2 8wx77jyhdr31c
Module: JDBC Thin Client
SELECT D.DERIVED_COMPANY ,CB.CLUSTER_BUCKET_ID ,CB.CB_NAME ,CB.SOA_ID ,COUNT(*) TOTAL ,NVL(SUM(CASE WHEN F.D_DATE_ID > TO_NUMBER(TO_CHAR(SYSDATE-30,'YYYYMMDD')) THEN 1 END), 0) RECENT ,NVL(D.BLACKLIST_FLG,0) BLACKLIST_FLG FROM F_DOWNLOADS F
,D_DOMAINS D ,D_PRODUCTS P ,PID_DF_ASSOC PDA ,( SELECT * FROM ( SELECT CLUSTER_
As of Oracle Database 10
g
, Oracle will automatically take a snapshot of your database once an hour and populate the underlying AWR tables that store the statistics. By default, seven days of statistics are retained.
You can also generate an AWR report for a specific SQL statement by running the awrsqrpt.sql report. When you run the following script, you will be prompted for the SQL_ID of the query of interest: SQL> @?/rdbms/admin/awrsqrpt.sql
Using ADDM
The ADDM report provides useful suggestions on which SQL statements are candidates for tuning. Use the following SQL script to generate an ADDM report:
SQL> @?/rdbms/admin/addmrpt
Look for the section of the report labeled “SQL statements consuming significant database time.”
Here is some sample output:
FINDING 2: 29% impact (65043 seconds)
-------------------------------------
SQL statements consuming significant database time were found.
RECOMMENDATION 1: SQL Tuning, 6.7% benefit (14843 seconds)
ACTION: Investigate the SQL statement with SQL_ID "46cc3t7ym5sx0" for possible performance improvements.
RELEVANT OBJECT: SQL statement with SQL_ID 46cc3t7ym5sx0 and
PLAN_HASH 1234997150
MERGE INTO d_files a
614
CHAPTER 22 ■ DATABASE TROUBLESHOOTING
USING
( SELECT
The ADDM report analyzes data in the AWR tables to identify potential bottlenecks and high resource-consuming SQL queries.