StandOut (23 page)
For StandOut, we designed situations from impact moments in life where a person’s preexisting skills or technical knowledge would have minimal relevance to response options. We created hundreds of situations and talent-based response options, then trialed them in multiple test environments. Iterations of specific “StandOut” life situations and response options were reviewed to isolate distinct personality differences and subsequently tested in an alpha version of StandOut that was administered to 232,000 participants across jobs and industries globally in 2009–2010. The psychometric properties of the assessment were analyzed to refine StandOut’s 146 situation and response combinations.
The 232,000 global participants who responded to the alpha version of StandOut had the option to report their demographic information. N = 6018 responded to at least one of the three demographic questions. Below is a summary of the demographic distributions.
TABLE 2: GENDER STATISTICS
| Frequency | Percentage | |
| Male | 2568 | 50.1 |
| Female | 2561 | 49.9 |
| Total | 6018 | |
TABLE 3: AGE STATISTICS
| Statistics | Age |
| Minimum | 17 |
| Maximum | 85 |
| Mean | 42 |
| Std. Deviation | 11 |
TABLE 4: EDUCATION STATISTICS
| Education Level | Frequency | Percentage |
| Less than high school | 11 | .2 |
| High school graduate | 169 | 2.8 |
| Some college | 636 | 10.6 |
| Associate degree | 227 | 3.8 |
| Bachelor’s degree | 2188 | 36.4 |
| Master’s degree | 1235 | 20.5 |
| Postgraduate degree | 445 | 7.4 |
| Other | 28 | .5 |
The Scoring
In scoring the response options for StandOut, we measured each of the nine strength Roles twelve times across thirty-four situations. Thirty-two of the situations offered four response options. Two of the situations had weighted computations with all nine strength Roles measured in each. Not all of the response options presented for each scenario were scored in the overall calculations. The scores by strength Role were coded and converted into a t-score calculation to standardize the distribution. The calculations of the scores for each of the response options involved weighting for degree of difficulty for each scenario and dimension reliability for each strength Role.
StandOut Stability and Reliability
Would you expect your StandOut results to change if you take the assessment more than once? If you are curious, we can take a look at the stability and reliability of the assessment. An initial reliability measure of these scores was completed on a random sample of N = 269 participants from the US workforce using Chi-Square and test-retest analysis of mean Role levels. The sample of participants completed the assessment in October 2010 and then completed the same assessment again in May 2011. A statistical analysis called the chi-square test of independence was conducted, with a dichotomous variable labeled “Strength Role Match from Time One to Time Two.”
In reviewing the top three strength Roles computed from the analysis, 90 percent of the sample had their leading Role in their top three from time one to time two, and 47 percent of the sample had two matches among their top three from time one to time two. All of the nine strength Roles had significant chi-square results, indicating that their presence in the top three roles on the initial administration of the assessment was significantly related (p < .05) to their presence in the top three roles during the second administration of the assessment.
TABLE 5: CHI-SQUARE TEST OF INDEPENDENCE RESULTS: N = 269
| Theme | Chi-Square | Significance |
| Advisor | 5.039 | .025 |
| Connector | 6.335 | .012 |
| Creator | 11.245 | .001 |
| Equalizer | 29.911 | .000 |
| Influencer | 9.444 | .002 |
| Pioneer | 25.460 | .000 |
| Provider | 6.822 | .009 |
| Stimulator | 28.906 | .000 |
| Teacher | 20.530 | .000 |
To scrutinize further the consistency of results from time one to time two, statisticians computed a t-test of change for each of the nine strength Roles. There were not significant differences in scores for any of the nine strength Roles from time one to time two (p < .05).
The Validity
The validity of an assessment must be evaluated with its intended purpose. The purpose of StandOut exists through its promise to help you pinpoint and channel your unique gifts. Built upon the principles of positive psychology, its application focuses your time on your strength Role as the path of least resistance to deliver results. Let’s dig a little deeper into what StandOut measures, then take a look at how these strength Roles have been validated with top performing leaders, managers, and sales associates.
Content Validity: What the StandOut Strengths Assessment Measures.
As we explored the data patterns from half a million talent assessments and listened through thousands of interviews to understand what explains success, it became apparent that the eighteen core predictive talents measured combine into common clusters with dominant peaks of frequency and intensity that best explain how someone will tend to think, feel, and behave.
StandOut measures how these talents converge into nine strength Roles, which are powerful, frequently reoccurring patterns that emerged through our research. For example, when you go looking for the answer to a question from my former head of research, you always learn something. While he knows the answer, he cannot just give you the answer. He needs to teach you how to find the answer on your own. He is a learner by nature and craves knowledge. He starts with where you are and develops you to be that much better. At his heart, in the language of StandOut, he is a Teacher. He peaks with intensity across three key talents—curiosity, individualization, and a coaching instinct—which come together to explain the brilliance of a Teacher. (Chapter 3 defines the nine StandOut strength Roles.)
Face Validity: Strengths Studies with Top Performers.
In the study of top performers for a given job, you will find that specific talent clusters emerge to explain success. As part of our research in the validation of StandOut, we sought to understand excellence in practice through the lens of our nine strength Roles. With each sample, we brought prior expectations from our experience. In every study, the stories through the data provided rich learning and strong face validity for StandOut.
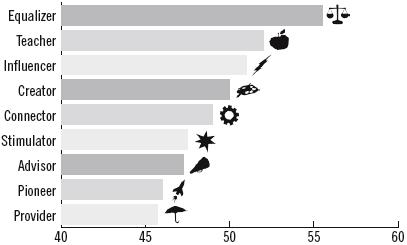
The following bar graph provides a summary of composite results from a study of 140 top executives from a national financial institution. The average scores by strength Roles are ranked from the highest scoring Role to the lowest scoring Role. Given the regulated nature of the industry, and the inherent need of Equalizers to create balance and order through doing the right thing, we expected to find Equalizer as a the primary strength Role. And we did.
Top Executives at a National Financial Institution (N = 140)
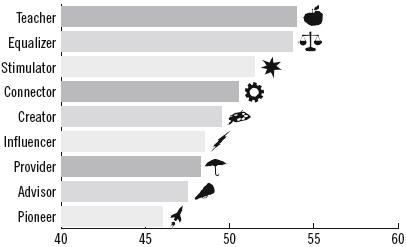
Likewise, aggregate data results from the study of fifty-five highest-rated general managers within a leading international hotel brand revealed three strengths at the top that would be expected given the demands of the job. First and foremost, an abundance of research would support that the best managers teach (Buckingham and Coffman,
First, Break All the Rules
, Simon & Schuster, 1999), so it is not surprising that their lead Role is Teacher—they understand the unique strengths of each team member and capitalize on those strengths to turn them into success. To do this, many create a spirited environment, where they honor and celebrate the success of each team member. This is the strengths path of Stimulators, which was ranked at three for the sample. Finally, to run a large hotel, it is critical to create order and structure—you need a clean room ready at the right time. So, it’s not surprising the Equalizer is ranked number two.
Top General Managers of an International Hotel Organization (N = 55)
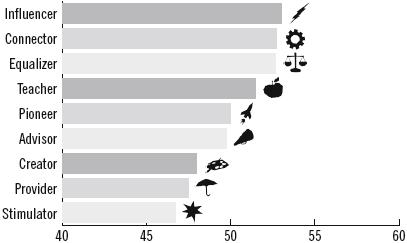
Forty-five sales organizations participated in a sales study of top talent. Each selected their two highest producers and invited them to participate in StandOut. A sample of N = 82 of the ninety selected as the best completed the assessment. You can probably predict what the aggregate data results revealed. Our anticipated strengths profile was validated with Influencer and Connector at the top and Equalizer a close third. It’s not surprising that the persuasion of the Influencer combined with their profound need to create a network—Connector—and make good on their commitments—Equalizer—merge to create the most successful sales representatives.
Top Sales Representatives from a National Association (N = 82)
Face validity was also apparent across studies with engineers, teachers, humanitarians, and private school principals.
StandOut, by design, fulfills its promise to reveal accurately how your top talents intersect to define your strength Roles. The beauty is that each of us is truly unique. We each offer something of rare and significant value. This value is fully realized only when we take accountability to offer up our most dominant strengths as we serve in work, and in life.