Storms of My Grandchildren (8 page)
Read Storms of My Grandchildren Online
Authors: James Hansen
The coup de grâce, the slaying of Charney’s climate sensitivity beast, is now obtained by considering the entire ice core record. The ice core provides a continuous record of atmospheric composition, while sea level records imply the changing size of continental ice sheets. Thus the climate forcings by atmosphere and surface are readily computed, as shown in the upper part of
figure 4
. The sum of these two curves, multiplied by 0.75 degree per watt, yields the calculated temperature curve (shown in the lower part of figure 4), which agrees remarkably well with observations.
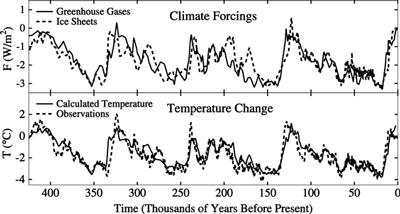
FIGURE 4.
Climate forcings due to greenhouse gas and surface reflectivity changes. Multiplication for the sum of these two forcings by 0.75 degree Celsius per watt yields the calculated temperature. The estimate for observed temperature is Antarctic temperature divided by two. (Figure from Hansen et al., “Target Atmospheric CO
2
.” See sources for chapter 8. For the original data, see sources for chapter 3.)
The most important merit of our empirically derived climate sensitivity is this: All physical mechanisms that exist in the real world are included—and furthermore, they are included correctly; the physics is exact. The resulting uncertainty, or “error bar,” on the derived fast-feedback climate sensitivity is small, about 0.5 degree Celsius for doubled carbon dioxide.
I should offer one caveat here. The climate sensitivity we have derived is valid for today’s climate and a broad range of climate states. But sensitivity depends on the climate state. Climate sensitivity graphed as a function of mean global temperature forms a U-shape curve. Global temperature today is at the bottom of the U curve, and the bottom is quite flat. But if the planet becomes much colder or much warmer, climate sensitivity will increase; indeed, we will meet the “snowball Earth” and “runaway greenhouse” instabilities. More on those in chapters 10 and 11.
Now we are ready to discuss the drive, the instigation, for the glacial to interglacial climate changes. The climate changes, remember, are enormous—resulting in either a flower garden in Central Park or a kilometer-thick layer of ice. The mechanisms immediately responsible for the entire global temperature change, as we have seen, are changes in the amount of greenhouse gas and surface reflectivity. But both these mechanisms are slow feedbacks, not the instigating forcing. The basic mechanisms instigating these changes were suspected for more than a century, and confirmed in the 1970s, but the profound implications are only beginning to be appreciated.
Instigation is provided by small changes to Earth’s tilt and orbit around the sun. These changes happen because other planets, especially the heavy ones, Jupiter and Saturn, tug on Earth as they move closer or farther away. The changes have almost no effect on the total amount of sunlight received by Earth averaged over the year. But they do affect the geographical and seasonal distribution of the insolation (a portmanteau of “incident solar radiation”). And they do affect climate in two essential ways.
The simplest effect is due to the change of Earth’s tilt, the inclination of the spin axis relative to the plane of the orbit. Today the tilt is about 23.5 degrees and slowly “straightening up.” It will reach its minimum tilt, about 22.1 degrees, in about 8,000 years. It takes about 41,000 years to go through the full cycle from minimum tilt, to maximum tilt (24.5 degrees), back to minimum tilt.
The effect of increased tilt is simple: The polar regions of both hemispheres are exposed to greater insolation, while lower latitudes receive less insolation. Increased tilt also causes the amount of summer insolation to increase and winter insolation to decrease. Both the latitudinal and seasonal radiation changes work in the sense of causing high-latitude ice sheets to melt when the tilt increases. Decreased tilt works in the opposite way: Warmer winters yield greater snowfall, and cooler summers increase the chance that snow can survive the warm season, allowing ice sheets to grow. Thus if tilt were the only factor, we would expect Earth to be headed now toward growth of high-latitude ice sheets, possibly toward an ice age, because the spin axis is straightening up.
The second insolation effect is only a bit more complicated. Earth’s orbit is slightly elliptical. Earth is now closest to the sun in January and farthest from the sun in July. But the day in the year at which Earth is closest to the sun moves through the entire calendar over the course of approximately 20,000 years (this is caused by Earth’s spin axis precessing like a wobbling top, but there is no need to visualize that geometry). Being closest to the sun in January is favorable to building ice sheets in the northern hemisphere, because it makes winter warmer and summer cooler. This second insolation effect works opposite in the two hemispheres, because January is midsummer in the southern hemisphere—so the present situation tends to melt ice in the southern hemisphere.
The second insolation effect is more complicated than the first because it depends on the eccentricity of Earth’s orbit—clearly the effect disappears entirely if the orbit becomes circular. The eccentricity of Earth’s orbit varies from nearly zero (circular orbit) to almost 6 percent. It is often said that the eccentricity varies with 100,000-year periodicity, but actually it does not have a simple periodicity. At present the eccentricity is quite small, about 1.7 percent, so the second insolation effect is quite weak.
Both insolation effects presently are pushing Earth toward building ice sheets in the northern hemisphere, and thus toward the next natural ice age. Without humans it is not certain whether the present interglacial period, the Holocene, would have ended in the next few thousand years, or whether it would have survived through another precession cycle, similar to the interglacial period 400,000 years ago, which lasted about 40,000 years. The reason to suspect that Earth may have avoided a near-term ice age is that the two insolation effects are out of phase by about 10,000 years, and the second effect is very weak because orbital eccentricity is so small.
However, despite the number of scientific papers this matter has generated, the question of when, absent humans, Earth would have headed into its next ice age is about as useful as asking how many angels can dance on a pin. Although both insolation effects now favor ice growth in the northern hemisphere, ice is actually melting rapidly. Human-made climate forcings are now in total dominance over the natural forcings.
The natural forcing due to insolation variations, averaged over the planet, is a small fraction of 1 watt. This very weak forcing is effective only because, operating over long periods, it succeeds in bringing into play two powerful slow feedbacks: global surface reflectivity changes and greenhouse gas changes. The forcing mechanism is seasonal and geographical insolation anomalies, which cause the area of ice and snow in a region or hemisphere to grow or diminish. Although this climate forcing is small, the minor effect on global temperature begins to bring into play the global surface albedo and carbon dioxide feedbacks. Methane and nitrous oxide work in the same way as carbon dioxide, increasing in atmospheric amount as the planet warms and decreasing as it cools. Thus, like carbon dioxide, they are amplifying feedbacks, but smaller ones than carbon dioxide. As shown by figure 4, the global surface albedo and greenhouse gas changes account for practically the entire global climate change.
Both global surface albedo and greenhouse gas amount are now under human control. The slow-feedback processes that cause glacial-to-interglacial oscillations are still operating, of course, but they respond, as they always have, to global temperature. The global cooling trend needed to cause the slow feedbacks that would take Earth into its next ice age no longer exists. Thus any thought that natural processes can still somehow move Earth toward the next ice age is utter nonsense. Humans, by rapidly burning fossil fuels, have caused global warming that overwhelms the natural tendency toward the next ice age. Global temperature always fluctuates on short time scales, because of the dynamical sloshings discussed in chapter 1. But human-made climate forcing is now so large that decadal-mean climate will continue to warm for at least the next few decades. Indeed, as we shall see, because of slow feedbacks, global temperature will continue to rise for decades and millennia unless we reduce human-made climate forcings.
The natural climate variations shown in figure 3 have a great deal more to tell us about the future. Note that warmings can proceed quite rapidly, because the disintegration of an ice sheet is a wet process, spurred by positive feedbacks. As the ice sheet begins to melt, it becomes darker, absorbing more sunlight. As the ice sheet’s thickness decreases, the surface is at a lower altitude, where it is warmer. There are other feedbacks, both amplifying and diminishing, which we will consider later. Overall, the empirical data show us that natural ice sheet disintegrations can be rapid, at rates up to several meters of sea level rise per century. Sea level fall is usually slower, limited by the snowfall rate in cold places. However, there have been instances—for example, when the meteorology was such that storm tracks consistently drove moist warm air into a region of ice sheet formation—in which sea level fell quite rapidly.
The past seven thousand years of sea level stability is an unusual event. This recent sea level stability occurred because Earth was warm enough to keep ice sheets from forming on North America and Eurasia but cool enough to maintain stable ice sheets on Greenland and Antarctica. The trick that stopped ice sheets from melting seven thousand years ago and kept the sea level almost stable was the slight cooling of Earth from the peak warmth that occurred in the early Holocene. Today, however, global warming of 0.8 degree Celsius in the past century, and of 0.6 degree Celsius in just the past thirty years, has brought global temperature back to at least peak Holocene level, and sea level rise is beginning to accelerate. Sea level is now rising more than three centimeters per decade—double the rate that occurred in the twentieth century.
Accurate measurements of mass being lost by Greenland and Antarctica did not yet exist when I spoke at the White House in 2003, so I used a photograph of surface melt on Greenland to show the kind of processes that could begin to speed climate change (similar to figure 6 on page 78). The photograph shows a small river of meltwater that had formed on the ice sheet and carried water to its base, where it increased the rate of discharge of icebergs to the ocean.
During my presentation, I argued that paleoclimate records provide guidance for the level of warming that would be dangerous from the perspective of sea level change. Specifically, I pointed out that prior warmer interglacial periods such as the Eemian were only about 1 degree Celsius warmer than today, on global average, yet sea level was four to six meters higher than today.
I described the rationale of the alternative scenario paper. If annual fossil fuel emissions level out within this decade and then begin to slowly decline, the CO2 increase by 2050 would be about 75 ppm. This is a very different scenario than envisioned by government energy departments, which assume that we will keep burning fossil fuels faster and faster, yet it seems conceivable if a constraint on coal is applied, specifically, a requirement of carbon capture and sequestration for future coal plants.
The other half of the alternative scenario involves the non–carbon dioxide forcings. I showed the White House group the bar graph in figure 1 (see page 6) for that discussion. After carbon dioxide, the two largest forcings are methane and black carbon (black soot).
The methane increase since preindustrial time causes about half as much warming as carbon dioxide. The methane warming includes indirect effects of methane on tropospheric ozone and stratospheric water vapor, because these gases are increased via chemical reactions caused by the methane. Methane emissions can be reduced by capture at coal mines, landfills, and agricultural and waste management facilities. The captured methane also has economic value as natural gas. Methane produces carbon dioxide when it is burned, but a methane molecule, with its indirect effects included, is 33 times more potent than a carbon dioxide molecule over a hundred years. Thus the warming effect of methane is reduced 97 percent if the methane is burned instead of released into the air.
Controlling black carbon is more complicated, if the aim is to reduce global warming. Many activities that produce black carbon also produce other aerosols such as sulfates and organic aerosols. These other aerosols are “white,” that is, they reflect sunlight and thus have a cooling effect. From a health standpoint, though, all aerosols are presumed to be bad.
My advice regarding black carbon was to place the greatest emphasis on reducing aerosol sources that have a dominance of black carbon over other aerosols. The example that I gave was diesel engines, which are frequently used for trucks, buses, and tractors. The needed regulation was not to ban diesel engines—which are generally more carbon dioxide efficient than gasoline engines—but rather to make emissions standards higher. Engine and “particle trap” technologies could reduce emissions by an order of magnitude with little loss of efficiency.