Read In Pursuit of the Unknown Online
Authors: Ian Stewart
In Pursuit of the Unknown (32 page)
However, Euler had never claimed that the formula worked for discontinuous functions
f(x)
, the most controversial feature of Fourier's work. The violin-string model didn't involve discontinuous initial conditions anyway â those would model a broken string, which would not vibrate at all. But for heat, it was natural to consider holding one region of a rod at one temperature and an adjacent region at a different one. In practice the transition would be smooth and very steep, but a discontinuous model was reasonable and more convenient for calculations. In fact, the solution to the heat equation explained
why
the transition would rapidly become smooth and very steep, as the heat diffused sideways. So an issue that Euler hadn't needed to worry about was becoming unavoidable, and Fourier suffered from the fallout.
Mathematicians were starting to realise that infinite series were dangerous beasts. They didn't always behave like nice finite sums. Eventually, these tangled complexities got sorted out, but it took a new
view of mathematics and a hundred years of hard work to do that. In Fourier's day, everyone thought they already knew what integrals, functions, and infinite series were, but in reality it was all rather vague â âI know one when I see one.' So when Fourier submitted his epoch-making paper, there were good reasons for the academy officials to be wary. They refused to budge, so in 1822 Fourier got round their objections by publishing his work as a book,
Théorie analytique de la chaleur
(âAnalytic Theory of Heat'). In 1824 he got himself appointed secretary of the academy, thumbed his nose at all the critics, and published his original 1811 memoir, unchanged, in the academy's prestigious journal.
We now know that although Fourier was right in spirit, his critics had good reasons for worrying about rigour. The problems are subtle and the answers are not terribly intuitive. Fourier analysis, as we now call it, works very well, but it has hidden depths of which Fourier was unaware.
The question seemed to be: when does the Fourier series converge to the function it allegedly represents? That is, if you take more and more terms, does the approximation to the function get ever better? Even Fourier knew that the answer was not âalways'. It seemed to be âusually, but with possible problems at discontinuities'. For instance at its midpoint, where the temperature jumps, the square wave's Fourier series converges â but to the wrong number. The sum is 0, but the square wave takes value 1.
For most physical purposes, it doesn't greatly matter if you change the value of a function at one isolated point. The square wave, thus modified, still
looks
square. It just does something slightly different at the discontinuity. To Fourier, this kind of issue didn't really matter. He was modelling the flow of heat, and he didn't mind if the model was a bit artificial, or needed technical changes that had no important effect on the end result. But the convergence issue could not be dismissed so lightly, because functions can have far more complicated discontinuities than a square wave.
However, Fourier was claiming that his method worked for any function, so it ought to apply even to functions such as:
f
(
x
) = 0 when
x
is rational, 1 when
x
is irrational. This function is discontinuous everywhere. For such functions, at that time, it wasn't even clear what the integral
meant
. And that turned out to be the real cause of the controversy. No one had defined what an integral was, not for strange functions like this one. Worse, no one had defined what a
function
was. And even if you could tidy up those omissions, it wasn't just a matter of
whether the Fourier series converged. The real difficulty was to sort out
in what sense
it converged.
Resolving these issues was tricky. It required a new theory of integration, supplied by Henri Lebesgue, a reformulation of the foundations of mathematics in terms of set theory, started by Georg Cantor and opening up several entirely new cans of worms, major insights from such towering figures as Riemann, and a dose of twentiethâcentury abstraction to sort out the convergence issues. The final verdict was that, with the right interpretations, Fourier's idea could be made rigorous. It worked for a very broad, though not universal, class of functions. Whether the series converged to
f
(
x
) for every value of
x
wasn't quite the right question; everything was fine provided the exceptional values of
x
where it didn't converge were sufficiently rare, in a precise but technical sense. If the function was continuous, the series converged for any
x
. At a jump discontinuity, like the change from 1 to â1 in the square wave, the series converged very democratically to the average of the values immediately to either side of the jump. But the series always converged to the function with the right interpretation of âconverge'. It converged as a whole, rather than point by point. Stating this rigorously depended on finding the right way to measure the distance between two functions. With all this in place, Fourier series did indeed solve the heat equation. But their real significance was much broader, and the main beneficiary outside pure mathematics was not the physics of heat but engineering. Especially electronic engineering.
In its most general form Fourier's method represents a signal, determined by a function
f
, as a combination of waves of all possible frequencies. This is called the Fourier transform of the wave. It replaces the original signal by its spectrum: a list of amplitudes and frequencies for the component sines and cosines, encoding the same information in a different way â engineers talk of transforming from the time domain to the frequency domain. When data are represented in different ways, operations that are difficult or impossible in one representation may become easy in the other. For example, you can start with a telephone conversation, form its Fourier transform, and strip out all parts of the signal whose Fourier components have frequencies too high or too low for the human ear to hear. This makes it possible to send more conversations over the same communication channels, and it's one reason why today's phone bills are, relatively speaking, so small. You can't play this game on the original,
untransformed signal, because that doesn't have âfrequency' as an obvious characteristic. You don't know what to strip out.
One application of this technique is to design buildings that will survive earthquakes. The Fourier transform of the vibrations produced by a typical earthquake reveals, among other things, the frequencies at which the energy imparted by the shaking ground is greatest. A building has its own natural modes of vibration, where it will resonate with the earthquake, that is, respond unusually strongly. So the first sensible step towards earthquake-proofing a building is to make sure that the building's preferred frequencies are different from the earthquake's. The earthquake's frequencies can be obtained from observations; those of the building can be calculated using a computer model.
This is just one of many ways in which, tucked away behind the scenes, the Fourier transform affects our lives. People who live or work in buildings in earthquake zones don't need to know how to calculate a Fourier transform, but their chance of surviving an earthquake is considerably improved because some people do. The Fourier transform has become a routine tool in science and engineering; its applications include removing noise from old sound recordings, such as clicks caused by scratches on vinyl records, finding the structure of large biochemical molecules such as DNA using X-ray diffraction, improving radio reception, tidying up photographs taken from the air, sonar systems such as those used by submarines, and preventing unwanted vibrations in cars at the design stage. I'll focus here on just one of the thousands of everyday uses of Fourier's magnificent insight, one that most of us unwittingly take advantage of every time we go on holiday: digital photography.
On a recent trip to Cambodia I took about 1400 photographs, using a digital camera, and they all went on a 2GB memory card with room for about 400 more. Now, I don't take particularly high-resolution photographs, so each photo file is about 1.1 MB. But the pictures are full colour, and they don't show any noticeable pixellation on a 27-inch computer screen, so the loss in quality isn't obvious. Somehow, my camera manages to cram into a single 2GB card about ten times as much data as the card can possibly hold. It's like pouring a litre of milk into an eggcup. Yet it all fits in. The question is: how?
The answer is data compression. The information that specifies the image is processed to reduce its quantity. Some of this processing is âlossless', meaning that the original raw information can if necessary be
retrieved from the compressed version. This is possible because most realworld images contain redundant information. Big blocks of sky, for instance, are often the same shade of blue (well, they are where we tend to go). Instead of repeating the colour and brightness information for a blue pixel over and over again, you could store the coordinates of two opposite corners of a rectangle and a short code that means âcolour this entire region blue'. That's not quite how it's done, of course, but it shows why lossless compression is sometimes possible. When it's not, âlossy' compression is often acceptable. The human eye is not especially sensitive to certain features of images, and these features can be recorded on a coarser scale without most of us noticing, especially if we don't have the original image to compare with. Compressing information this way is like scrambling an egg: it's easy in one direction, and does the required job, but it's not possible to reverse it. Non-redundant information is lost. It was just information that didn't do a lot to begin with, given how human vision works.
My camera, like most point-and-click ones, saves its images in files with labels like P1020339.JPG. The suffix refers to JPEG, the Joint Photographic Experts Group, and it indicates that a particular system of data compression has been used. Software for manipulating and printing photos, such as Photoshop or iPhoto, is written so that it can decode the JPEG format and turn the data back into a picture. Millions of us use JPEG files regularly, fewer are aware that they're compressed, and fewer still wonder how it's done. This is not a criticism: you don't have to know how it works to use it, that's the point. The camera and software handle it all for you. But it's often sensible to have a rough idea of what software does, and how, if only to discover how cunning some of it is. You can skip the details here if you wish: I'd like you to appreciate just how
much
mathematics goes into each image on your camera's memory card, but exactly
what
mathematics is less important.
The JPEG format
2
combines five different compression steps. The first converts the colour and brightness information, which starts out as three intensities for red, green, and blue, into three different mathematically equivalent ones that are more suited to the way the human brain perceives images. One (luminance) represents the overall brightness â what you would see with a black-and-white or âgreyscale' version of the same image. The other two (chrominance) are the differences between this and the amounts of blue and red light, respectively.
Next, the chrominance data are coarsened: reduced to a smaller range of numerical values. This step alone halves the amount of data. It does no
perceptible harm because the human visual system is much less sensitive to colour differences than the camera is.
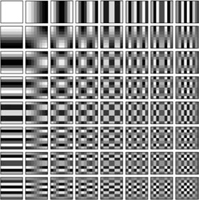
The third step uses a variant of the Fourier transform. This works not with a signal that changes over time, but with a pattern in two dimensions of space. The mathematics is virtually identical. The space concerned is an 8 Ã 8 sub-block of pixels from the image. For simplicity think just of the luminance component: the same idea applies to the colour information as well. We start with a block of 64 pixels, and for each of them we need to store one number, the luminance value for that pixel. The discrete cosine transform, a special case of the Fourier transform, decomposes the image into a superposition of standard âstriped' images instead. In half of them the stripes run horizontally; in the other half they are vertical. They are spaced at different intervals, like the various harmonics in the usual Fourier transform, and their greyscale values are a close approximation to a cosine curve. In coordinates on the block they are discrete versions of cos
mx
cos
ny
for various integers
m
and
n
, see
Figure 41
.