Our Black Year (37 page)
Authors: Maggie Anderson
Â
EXHIBIT 4
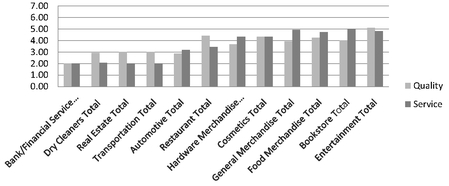
Lowest Quality and Service Ratings by Sector
Lowest Quality and Service Ratings by Sector

Finding Black-owned businesses that could meet the Andersons' product and service needs was a challenge. The main channels utilized were web research, personal referrals, and organizational referrals (
Exhibit 5
). These three channels accounted for a purchase total of $37,530.62 (~77% of the purchases). Black-owned business web directories
FindmeChicago.com
and
Blackpages.com
were significant web research sources for the Andersons, while the Chicago Urban League was the dominant source for organizational referrals.
Â
EXHIBIT 5
Sources as % of Dollars Spent
Sources as % of Dollars Spent

Assumptions
Over the course of the experiment, the Andersons' purchases were made primarily but not exclusively in the Chicago metropolitan area. In this paper, we focused on purchases made from Black-owned businesses within the Chicago metropolitan area. Additionally, products that were manufactured by Black-owned firms but not purchased in Black-owned establishments were not included (example: Sean John shirt purchased at Carson Pirie Scott).
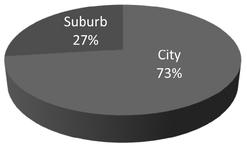
AnalysisThe majority of Black-owned businesses from which the Andersons purchased were located in the city of Chicago versus its surrounding suburbs (
Exhibit 6
). The majority of the businesses (73%) were located in the city and 27% in the suburbs. Also, a large portion of the purchases were from businesses located on the city's South Side and Chicago's western suburbs (
Exhibit 7
). This observation is consistent with the fact that the Andersons live in a western Chicago suburb (
Exhibit 7
).
Â
EXHIBIT 6
Proportion of Businesses by Location (Chicago vs. Suburbs)
Proportion of Businesses by Location (Chicago vs. Suburbs)

Â
EXHIBIT 7
Number of Black-Owned Businesses per Region
Number of Black-Owned Businesses per Region

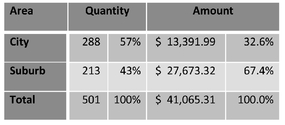
In terms of the frequency of purchases, the purchases were more likely to be made in the city rather than the suburbs (see
Exhibit 8
), however the total dollars spent were significantly higher in the suburbs.
Exhibit 8
), however the total dollars spent were significantly higher in the suburbs.
Â
Number of Purchases Made at Black-Owned Businesses and Dollars Spent (Chicago vs. Suburbs)

Â
Number of Purchases Made at Black-Owned Businesses by Region

Following the city vs. suburbs analysis was an exploration of purchase locations within Chicago (i.e. north, south, west, downtown, northwest, and southwest). Per
Exhibit 9
, the majority of purchases made in the city were made in communities on the South and West sides of the city (65% and 31%), which are predominantly African American.
Exhibit 9
, the majority of purchases made in the city were made in communities on the South and West sides of the city (65% and 31%), which are predominantly African American.
In contrast to number of purchases,
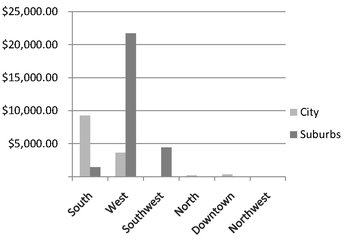
Exhibit 10
shows that the highest amount of dollars spent was on the city's South Side rather than the West Side ($9,199.78 versus $3,651). For purchases made in the suburbs, the highest quantity of dollars spent was in the western suburbs ($21,725).
Exhibit 10
shows that the highest amount of dollars spent was on the city's South Side rather than the West Side ($9,199.78 versus $3,651). For purchases made in the suburbs, the highest quantity of dollars spent was in the western suburbs ($21,725).
Â
Dollars Spent with Black-Owned Businesses by Region

These data on the number of Black-owned businesses patronized by the Andersons and the quantity of dollars spent are not representative of the total Black-owned businesses across the Chicago metropolitan area. The Andersons' purchases are a single data point and are representative solely of the family's needs and purchases, not of the typical Black household. However, this data does show that for the Andersons' purchases, they needed to travel extensively across the Chicago metropolitan area to obtain products or services they needed.
THE POTENTIAL BENEFITS OF SELF-HELP ECONOMICSAnalysis of The Empowerment Experiment data has demonstrated that in a metropolitan area, namely Chicago, Black families have the power to impact Black businesses by purposefully spending their disposable income. It is important to note that as a one-family sample, the findings cannot be perfectly statistically generalized to the US population as a whole. However, the experiment provides an illustration of what may be possible.
While the Andersons directed approximately 68% of their after-tax income to Black businesses, this large percentage may not be attainable for many Black families who cannot or will not devote an extraordinary amount of time searching for, traveling to, and repeatedly purchasing from Black-owned businesses. Accordingly, we ran a number of scenarios, from 2% to 68%, to identify the aggregate impact that Black households with an annual income of $75,000 or higher can have on Black businesses. By spending 10% of their income on Black businesses, these households can theoretically transfer over $17.5 billion in revenue for said businesses.
Current Self-Help Economics in the Black CommunityStatistics detailing exactly how much Black consumers currently spend with Black businesses are hard to find.
Black-business-owners.com
claims that African Americans currently spend 6â8% of their disposable income with Black businesses, but the origins of the data are unclear. In his book
PowerNomics
, Claud Anderson cites: “We spend approximately 95% of our income outside of our communities. Only two percent remains in Black hands inside the Black community.”
2
Based on these two sources, we will assume Black consumers recycle between 2% (conservatively) and 5% of their after-tax income within the Black community.
Â
EXHIBIT 11
Current Dollars Recycled in Black Community (assuming after-tax income percentages)
Current Dollars Recycled in Black Community (assuming after-tax income percentages)

With these assumptions, it is clear that the Black community is forgoing potential benefits of group economics by not spending and/or reinvesting more money within the Black community. The numbers are striking: In 2008, Black buying power was estimated to be approximately $913 billion; in 2013, it is expected to reach $1.2 trillion.
3
Unfortunately, even with liberal estimates, only pennies on the Black dollar are staying within the Black community (
Exhibit 11
).
3
Unfortunately, even with liberal estimates, only pennies on the Black dollar are staying within the Black community (
Exhibit 11
).
Other books
Frontiers Saga 10: Liberation by Ryk Brown
Burning Barriers (Barriers Series Book 3) by Shirley, Sara
The Guardian's Protector: The Chamber of Souls by Debbie Kowalczyk
Mason by Thomas Pendleton
Twist of Fate by Jayne Ann Krentz
An Inconvenient Love (Crimson Romance) by Alexia Adams
Just Cause: Revised & Expanded Edition by Ian Thomas Healy
Billionaire Twins: Two The Hard Way by Erica Storm
The Alien Star Chamber (Part One) by V Bertolaccini