The Better Angels of Our Nature: Why Violence Has Declined (46 page)
Read The Better Angels of Our Nature: Why Violence Has Declined Online
Authors: Steven Pinker
Tags: #Sociology, #Psychology, #Science, #Social History, #21st Century, #Crime, #Anthropology, #Amazon.com, #Retail, #Criminology
But a few generalizations did survive. A long-standing government inhibits fighting: peoples on one side of a national border are less likely to have a civil war than peoples on opposite sides are to have an interstate war. Countries are more likely to fight their neighbors, but great powers are more likely to fight everyone, largely because their far-flung empires make almost everyone their neighbors. Certain cultures, especially those with a militant ideology, are particularly prone to go to war.
But Richardson’s most enduring discoveries are about the statistical patterning of wars. Three of his generalizations are robust, profound, and underappreciated. To understand them, we must first take a small detour into a paradox of probability.

Suppose you live in a place that has a constant chance of being struck by lightning at any time throughout the year. Suppose that the strikes are random: every day the chance of a strike is the same, and the rate works out to one strike a month. Your house is hit by lightning today, Monday. What is the most likely day for the
next
bolt to strike your house?
next
bolt to strike your house?
The answer is “tomorrow,” Tuesday. That probability, to be sure, is not very high; let’s approximate it at 0.03 (about once a month). Now think about the chance that the next strike will be the day after tomorrow, Wednesday. For that to happen, two things have to take place. First lightning has to strike on Wednesday, a probability of 0.03. Second, lightning
can’t have struck on Tuesday
, or else Tuesday would have been the day of the next strike, not Wednesday. To calculate that probability, you have to multiply the chance that lightning will not strike on Tuesday (0.97, or 1 minus 0.03) by the chance that lightning will strike on Wednesday (0.03), which is 0.0291, a bit lower than Tuesday’s chances. What about Thursday? For that to be the day, lightning can’t have struck on Tuesday (0.97) or on Wednesday either (0.97 again) but it must strike on Thursday, so the chances are 0.97 × 0.97 × 0.03, which is 0.0282. What about Friday? It’s 0.97 × 0.97 × 0.97 × 0.03, or 0.274. With each day, the odds go down (0.0300 . . . 0.0291 . . . 0.0282 . . . 0.0274), because for a given day to be the next day that lightning strikes, all the previous days have to have been strike-free, and the more of these days there are, the lower the chances are that the streak will continue. To be exact, the probability goes down exponentially, accelerating at an accelerating rate. The chance that the next strike will be thirty days from today is 0.97
29
× 0.03, barely more than 1 percent.
Almost no one gets this right. I gave the question to a hundred Internet users, with the word
next
italicized so they couldn’t miss it. Sixty-seven picked the option “every day has the same chance.” But that answer, though intuitively compelling, is wrong. If every day were equally likely to be the next one, then a day a thousand years from now would be just as likely as a day a month from now. That would mean that the house would be just as likely to go a thousand years without a strike as to suffer one next month. Of the remaining respondents, nineteen thought that the most likely day was a month from today. Only five of the hundred correctly guessed “tomorrow.”
Lightning strikes are an example of what statisticians call a Poisson process (pronounced
pwah-sonh
), named after the 19th-century mathematician and physicist Siméon-Denis Poisson. In a Poisson process, events occur continuously, randomly, and independently of one another. Every instant the lord of the sky, Jupiter, rolls the dice, and if they land snake eyes he hurls a thunderbolt. The next instant he rolls them again, with no memory of what happened the moment before. For reasons we have just seen, in a Poisson process the intervals between events are distributed exponentially: there are lots of short intervals and fewer and fewer of them as they get longer and longer. That implies that events that occur at random will seem to come in clusters, because it would take a
non
random process to space them out.
The human mind has great difficulty appreciating this law of probability. When I was a graduate student, I worked in an auditory perception lab. In one experiment listeners had to press a key as quickly as possible every time they heard a beep. The beeps were timed at random, that is, according to a Poisson process. The listeners, graduate students themselves, knew this, but as soon as the experiment began they would run out of the booth and say, “Your random event generator is broken. The beeps are coming in bursts. They sound like this: “beepbeepbeepbeepbeep . . . beep . . . beepbeep . . . beepitybeepitybeepbeepbeep.” They didn’t appreciate that that’s what randomness sounds like.
This cognitive illusion was first noted in 1968 by the mathematician William Feller in his classic textbook on probability: “To the untrained eye, randomness appears as regularity or tendency to cluster.”
33
Here are a few examples of the cluster illusion.
33
Here are a few examples of the cluster illusion.
The London Blitz
. Feller recounts that during the Blitz in World War II, Londoners noticed that a few sections of the city were hit by German V-2 rockets many times, while others were not hit at all. They were convinced that the rockets were targeting particular kinds of neighborhoods. But when statisticians divided a map of London into small squares and counted the bomb strikes, they found that the strikes followed the distribution of a Poisson process—the bombs, in other words, were falling at random. The episode is depicted in Thomas Pynchon’s 1973 novel
Gravity’s Rainbow
, in which statistician Roger Mexico has correctly predicted the distribution of bomb strikes, though not their exact locations. Mexico has to deny that he is a psychic and fend off desperate demands for advice on where to hide.
The gambler’s fallacy
. Many high rollers lose their fortunes because of the gambler’s fallacy: the belief that after a run of similar outcomes in a game of chance (red numbers in a roulette wheel, sevens in a game of dice), the next spin or toss is bound to go the other way. Tversky and Kahneman showed that people think that genuine sequences of coin flips (like
TTHHTHTTTT)
are fixed, because they have more long runs of heads or of tails than their intuitions allow, and they think that sequences that were jiggered to avoid long runs (like
HTHTTHTHHT)
are fair.
34
The birthday paradox.
Most people are surprised to learn that if there are at least 23 people in a room, the chances that two of them will share a birthday are better than even. With 57 people, the probability rises to 99 percent. In this case the illusory clusters are in the calendar. There are only so many birthdays to go around (366), so a few of the birthdays scattered throughout the year are bound to fall onto the same day, unless there was some mysterious force trying to separate them.
Most people are surprised to learn that if there are at least 23 people in a room, the chances that two of them will share a birthday are better than even. With 57 people, the probability rises to 99 percent. In this case the illusory clusters are in the calendar. There are only so many birthdays to go around (366), so a few of the birthdays scattered throughout the year are bound to fall onto the same day, unless there was some mysterious force trying to separate them.
Constellations
. My favorite example was discovered by the biologist Stephen Jay Gould when he toured the famous glowworm caves in Waitomo, New Zealand.
35
The worms’ pinpricks of light on the dark ceiling made the grotto look like a planetarium, but with one difference: there were no constellations. Gould deduced the reason. Glowworms are gluttonous and will eat anything that comes within snatching distance, so each worm gives the others a wide berth when it stakes out a patch of ceiling. As a result, they are more evenly spaced than stars, which from our vantage point are randomly spattered across the sky. Yet it is the stars that seem to fall into shapes, including the ram, bull, twins, and so on, that for millennia have served as portents to pattern-hungry brains. Gould’s colleague, the physicist Ed Purcell, confirmed Gould’s intuition by programming a computer to generate two arrays of random dots. The virtual stars were plonked on the page with no constraints. The virtual worms were given a random tiny patch around them in which no other worm could intrude. They are shown in figure 5–5; you can probably guess which is which. The one on the left, with the clumps, strands, voids, and filaments (and perhaps, depending on your obsessions, animals, nudes, or Virgin Marys) is the array that was plotted at random, like stars. The one on the right, which seems to be haphazard, is the array whose positions were nudged apart, like glowworms.
Richardson’s data.
My last example comes from another physicist, our friend Lewis Fry Richardson. These are real data from a naturally occurring phenomenon. The segments in figure 5–6 represent events of various durations, and they are arranged from left to right in time and from bottom to top in magnitude. Richardson showed that the events are governed by a Poisson process: they stop and start at random. Your eye may discern some patterns—for example, a scarcity of segments at the top left, and the two floaters at the top right. But by now you have learned to distrust these apparitions. And indeed Richardson showed that there was no statistically significant trend in the distribution of magnitudes from the beginning of the sequence to the end. Cover up the two outliers with your thumb, and the impression of randomness is total.
My last example comes from another physicist, our friend Lewis Fry Richardson. These are real data from a naturally occurring phenomenon. The segments in figure 5–6 represent events of various durations, and they are arranged from left to right in time and from bottom to top in magnitude. Richardson showed that the events are governed by a Poisson process: they stop and start at random. Your eye may discern some patterns—for example, a scarcity of segments at the top left, and the two floaters at the top right. But by now you have learned to distrust these apparitions. And indeed Richardson showed that there was no statistically significant trend in the distribution of magnitudes from the beginning of the sequence to the end. Cover up the two outliers with your thumb, and the impression of randomness is total.
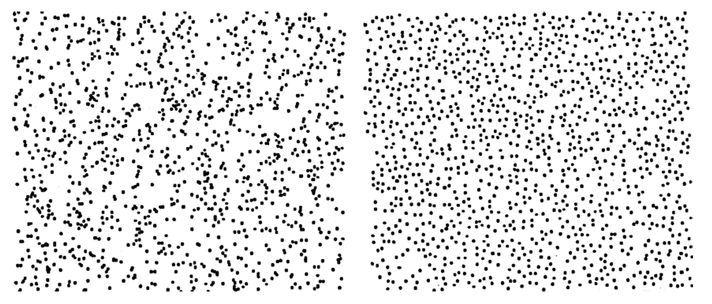
FIGURE 5–5.
Random and nonrandom patterns
Random and nonrandom patterns
Sources:
Displays generated by Ed Purcell; reproduced from Gould, 1991, pp. 266–67.
Displays generated by Ed Purcell; reproduced from Gould, 1991, pp. 266–67.
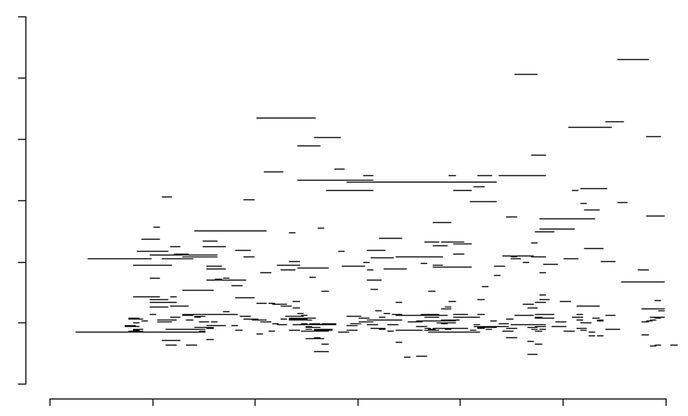
FIGURE 5–6.
Richardson’s data
Richardson’s data
Source:
Graph from Hayes, 2002, based on data in Richardson, 1960.
Graph from Hayes, 2002, based on data in Richardson, 1960.
You can probably guess what the data represent. Each segment is a war. The horizontal axis marks off quarter-centuries from 1800 to 1950. The vertical axis indicates the magnitude of the war, measured as the base-ten logarithm of the number of deaths, from two at the bottom (a hundred deaths) to eight at the top (a hundred million deaths). And the two segments in the upper right correspond to World War I and World War II.
Richardson’s major discovery about the timing of wars is that they begin at random. Every instant Mars, the god of war, rolls his iron dice, and if they turn up snake eyes he sends a pair of nations to war. The next instant he rolls them again, with no memory of what happened the moment before. That would make the distribution of intervals between war onsets exponential, with lots of short intervals and fewer long ones.
The Poisson nature of war undermines historical narratives that see constellations in illusory clusters. It also confounds theories that see grand patterns, cycles, and dialectics in human history. A horrible conflict doesn’t make the world weary of war and give it a respite of peaceable exhaustion. Nor does a pair of belligerents cough on the planet and infect it with a contagious war disease. And a world at peace doesn’t build up a mounting desire for war, like an unignorable itch, that eventually must be discharged in a sudden violent spasm. No, Mars just keeps rolling the dice. Some half-dozen other war datasets have been assembled during and after Richardson’s time; all support the same conclusion.
36
36
Other books
Amos's Killer Concert Caper by Gary Paulsen
Fixated On You (Torn Series #5) by Ann, Pamela
Unwanted Stars by Melissa Brown
Invisible Lives by Anjali Banerjee
Dawn and the Dead by Nicholas John
Dire Straits by Megan Derr
Gifts From The Stars by James Octavo
Knights of the Hawk by James Aitcheson
Business Doctors - Management Consulting Gone Wild by Sameer Kamat
Healing the Bayou by Mary Bernsen