How to Read a Paper: The Basics of Evidence-Based Medicine (27 page)
Read How to Read a Paper: The Basics of Evidence-Based Medicine Online
Authors: Trisha Greenhalgh
As this example shows, ‘non-significant’ trials (i.e. ones that, on their own, did not demonstrate a significant difference between treatment and control groups) contribute to a pooled result in a meta-analysis that
is
statistically significant. The most famous example of this, which the Cochrane Collaboration adopted as its logo (
Figure 9.3
), is the meta-analysis of seven trials of the effect of giving steroids to mothers who were expected to give birth prematurely [15]. Only two of the seven trials showed a statistically significant benefit (in terms of survival of the infant), but the improvement in precision (i.e. the narrowing of confidence intervals) in the pooled results, shown by the narrower width of the diamond compared with the individual lines, demonstrates the strength of the evidence in favour of this intervention. This meta-analysis showed that infants of steroid-treated mothers were 30–50% less likely to die than infants of control mothers. This example is discussed further in section ‘Why are health professionals slow to adopt evidence-based practice?’ in relation to changing clinicians' behaviour.
Figure 9.3
Cochrane Collaboration Logo.

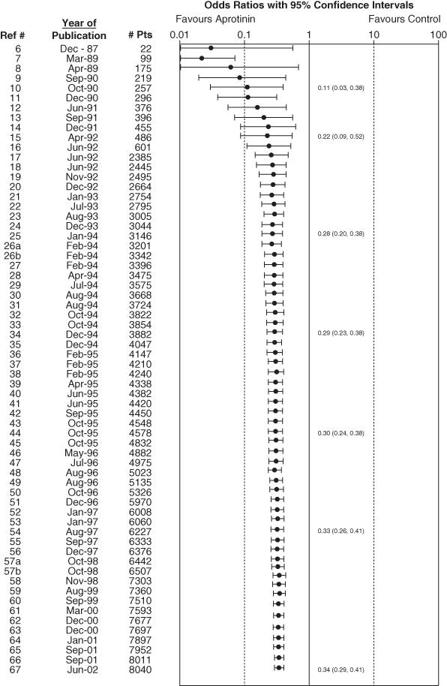
You may have worked out by now that anyone who is thinking about doing a clinical trial of an intervention should first do a meta-analysis of all the previous trials on that same intervention. In practice, researchers only occasionally do this. Dean Fergusson and colleagues of the Ottawa Health Research Institute published a cumulative meta-analysis of all randomised controlled trials carried out on the drug aprotinin in peri-operative bleeding during cardiac surgery [16]. They lined up the trials in the order they had been published, and worked out what a meta-analysis of ‘all trials done so far’ would have shown (had it been performed at the time). The resulting
cumulative meta-analysis
had shocking news for the research communities. The beneficial effect of aprotinin reached statistical significance after only 12 trials—that is, back in 1992. But because nobody did a meta-analysis at the time, a further 52 clinical trials were undertaken (and more may be ongoing). All these trials were scientifically unnecessary and unethical (because half the patients were denied a drug that had been proved to improve outcome).
Figure 9.4
illustrates this waste of effort.
Figure 9.4
Cumulative meta-analysis of randomised controlled trials of aprotinin in cardiac surgery [16]. Reproduced with permission of Clinical Trials.

If you have followed the arguments on meta-analysis of published trial results this far, you might like to read up on the more sophisticated technique of meta-analysis of individual patient data, which provides a more accurate and precise figure for the point estimate of effect [17]. You might also like to hunt out what is becoming the classic textbook on the topic [18].
Explaining heterogeneity
In everyday language, ‘homogeneous’ means ‘of uniform composition’, and ‘heterogeneous’ means ‘many different ingredients’. In the language of meta-analysis, homogeneity means that the results of each individual trial are compatible with the results of any of the others. Homogeneity can be estimated at a glance once the trial results have been presented in the format illustrated in
Figures 9.2
and
9.5
. In
Figure 9.2
, the lower confidence interval of every trial is below the upper confidence interval of all the others (i.e. the horizontal lines all overlap to some extent). Statistically speaking, the trials are homogeneous. Conversely, in
Figure 9.4
, there are some trials whose lower confidence interval is above the upper confidence interval of one or more other trials (i.e. some lines do not overlap at all). These trials may be said to be heterogeneous.
Figure 9.5
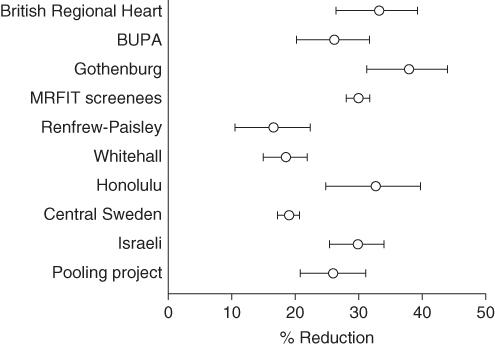
Reduction in heart disease risk by cholesterol-lowering strategies.
Source: Greenhalgh [20]. Reproduced with permission of Royal College of General Practitioners.

You may have spotted by now (particularly if you have already read section ‘Have confidence intervals been calculated, and do the authors' conclusions reflect them?’ on confidence intervals) that pronouncing a set of trials heterogeneous on the basis of whether their confidence intervals overlap is somewhat arbitrary, as the confidence interval itself is arbitrary (it can be set at 90%, 95%, 99% or indeed any other value). The definitive test involves a slightly more sophisticated statistical manoeuvre than holding a ruler up against the blobbogram. The one most commonly used is a variant of the Chi-square (
χ
2
) test (see
Table 5.1
), as the question addressed is, ‘is there greater variation between the results of the trials than is compatible with the play of chance?’.
The
χ
2
statistic for heterogeneity is explained in more detail by Thompson [19], who offers the following useful rule of thumb: a
χ
2
statistic has, on average, a value equal to its degrees of freedom (in this case, the number of trials in the meta-analysis minus one), so a
χ
2
of 7.0 for a set of 8 trials would provide no evidence of statistical heterogeneity. (In fact, it would not prove that the trials were homogeneous either, particularly because the
χ
2
test has low power (see section ‘Were preliminary statistical questions addressed?’) to detect small but important levels of heterogeneity.)
A
χ
2
value much greater than the number of trials in a meta-analysis tells us that the trials that contributed to the analysis are different in some important way from one another. There may, for example, be known differences in method (e.g. authors may have used different questionnaires to assess the symptoms of depression), or known clinical differences in the trial participants (e.g. one centre might have been a tertiary referral hospital to which all the sickest patients were referred). There may, however, be unknown or unrecorded differences between the trials which the meta-analyst can only speculate upon until he or she has extracted further details from the trials' authors. Remember: demonstrating statistical heterogeneity is a mathematical exercise and is the job of the statistician, but
explaining
this heterogeneity (i.e. looking for, and accounting for,
clinical
heterogeneity) is an interpretive exercise and requires imagination, common sense and hands-on clinical or research experience.
Figure 9.5
, which is reproduced with permission from Thompson's [19] chapter on the subject, shows the results of ten trials of cholesterol-lowering strategies. The results are expressed as the percentage reduction in heart disease risk associated with each 0.6 mmol/l reduction in serum cholesterol level. The horizontal lines represent the 95% confidence intervals of each result, and it is clear, even without being told the
χ
2
statistic of 127, that the trials are highly heterogeneous.
To simply ‘average out’ the results of the trials in
Figure 9.5
would be very misleading. The meta-analyst must return to his or her primary sources and ask, ‘in what way was trial A different from trial B, and what do trials E, F and H have in common which makes their results cluster at one extreme of the figure?’ In this example, a correction for the age of the trial participants reduced
χ
2
from 127 to 45. In other words, most of the ‘incompatibility’ in the results of these trials can be explained by the fact that embarking on a strategy (such as a special diet) that successfully reduces your cholesterol level will be substantially more likely to prevent a heart attack if you are 45 than if you are 85.
This, essentially, is the essence of the grievance of Professor Hans Eysenck [21], who has constructed a vigorous and entertaining critique of the science of meta-analysis. In a world of lumpers and splitters, Eysenck is a splitter, and it offends his sense of the qualitative and the particular (see Chapter 12) to combine the results of studies that were performed on different populations in different places at different times and for different reasons.
Eysenck's reservations about meta-analysis are borne out in the infamously discredited meta-analysis that demonstrated (wrongly) that there was significant benefit to be had from giving intravenous magnesium to heart attack victims. A subsequent megatrial involving 58 000 patients (ISIS-4) failed to find any benefit whatsoever, and the meta-analysts' misleading conclusions were subsequently explained in terms of publication bias, methodological weaknesses in the smaller trials and clinical heterogeneity [22] [23]. (Incidentally, for more debate on the pros and cons of meta-analysis versus megatrials, see this recent paper [24].)
Eysenck's mathematical naiveté is embarrassing (‘if a medical treatment has an effect so recondite and obscure as to require a meta-analysis to establish it, I would not be happy to have it used on me’), which is perhaps why the editors of the second edition of the ‘Systematic reviews’ book dropped his chapter from their collection. But I have a great deal of sympathy for the principle of his argument. As one who tends to side with the splitters, I would put Eysenck's misgivings about meta-analysis high on the list of required reading for the aspiring systematic reviewer. Indeed, I once threw my own hat into the ring when Griffin [25] published a meta-analysis of primary studies into the management of diabetes by primary health care teams. Although I have a high regard for Simon as a scientist, I felt strongly that he had not been justified in performing a mathematical summation of what I believed were very different studies all addressing slightly different questions. As I said in my commentary on his article, ‘four apples and five oranges make four apples and five oranges, not nine apple and oranges’ [26]. But Simon numbers himself among the lumpers, and there are plenty of people cleverer than I who have argued that he was entirely correct to analyse his data as he did. Fortunately, the two of us have agreed to differ—and on a personal level we remain friends.
New approaches to systematic review
This chapter has addressed the most commonly used approach to systematic review—synthesising trials of therapy. If you're comfortable with that, you might like to start exploring the literature on more challenging forms of systematic review—such as diagnostic studies [27] and the emerging science of systematic review of qualitative research (and mixed qualitative and quantitative studies), which I discuss in more detail in Chapter 11. For my own part, I've been working with colleagues to develop new approaches to systematic review that highlight and explore (rather than attempt to ‘average out’) the fundamental differences between primary studies—an approach that I think is particularly useful for developing systematic reviews in health care policymaking [28] [29]. But these relatively small-print applications are all beyond the basics, and if you're reading this book to get you through an exam, you'll probably find they aren't on the syllabus.