Understanding Sabermetrics (20 page)
Read Understanding Sabermetrics Online
Authors: Gabriel B. Costa,Michael R. Huber,John T. Saccoma
The final adjustment comes when the sum of the individual RC is significantly greater (or less) than the team’s runs scored. For example, a 5 percent discrepancy in either direction will bring a commensurate 5 percent raising (or lowering) of each individual’s RC.
From this context, James then developed his new rating system, Win Shares.
Win Shares: An OverviewThe “win shares” concept is the latest in James’ quest for the perfect evaluation system. Essentially, a team’s wins are multiplied by three, and then the individual players are assigned a portion of that total based on hitting /base running, fielding, and pitching contributions. Roughly 48 percent of the available win shares are assigned to the first category, 17 percent to the second, and 35 percent to the third.
For individuals, a 30 win share season is of MVP-caliber, and a season over 40 is historic. The pitchers pre-1893, many of whom pitched 400-500 innings per season, scored off the win-shares chart. James adjusted this by dividing these pitchers’ totals by two, or else all of the top seasons in baseball history would have been concentrated in those players, a seemingly unlikely occurrence.
Selecting a random team from baseball history, the 1901 Philadelphia Phillies, second place finishers in the NL, went 83-57. Thus, 249 win-shares are available to be claimed. According to the 2002 book
Win Shares
by Bill James and Jim Henzler, 107.1 (43 percent) of the win shares were assigned for offense, 45.3 (18 percent) were assigned for fielding, and 96.6 (39 percent) were assigned for pitching.
Win Shares
by Bill James and Jim Henzler, 107.1 (43 percent) of the win shares were assigned for offense, 45.3 (18 percent) were assigned for fielding, and 96.6 (39 percent) were assigned for pitching.
The Phils were led by Hall of Fame outfielder Ed Delahanty’s 33 win shares. This total tied him (along with Boston hurler Vic Willis and Brooklyn outfielder Jimmy Sheckard) for third in the NL. Jess Burkett at 38 and Honus Wagner at 37 paced the NL. The Philadelphia Athletics’ Nap Lajoie (42) led the majors, and Baltimore’s Cy Young was second in the AL with 41.
In Inning 6, we presented the Pythagorean formula, a way of predicting a team’s record based on runs scored and allowed. In conjunction with win shares, James developed a concept known as marginal runs, another way to predict a team’s record, based on the number of runs allowed less than the average and the number of runs scored greater than the league average. Thus, marginal runs are divided into two categories, offensive and defensive. On the offensive side, he defines a marginal run as any run scored by a team in excess of one-half the league average, i.e., team runs minus one-half the league average, or R
TEAM
- (0.5 × R
LGAVG
) = MR. For defense, marginal runs are defined as each run allowed below 1.5 times the league average, or (1.5 × R
LGAVG
) - RA
TEAM
.
TEAM
- (0.5 × R
LGAVG
) = MR. For defense, marginal runs are defined as each run allowed below 1.5 times the league average, or (1.5 × R
LGAVG
) - RA
TEAM
.
In the National League in 1901, there were 5194 runs scored, and eight teams, which translates to an average of 649.25 runs per team. Thus, for the NL in 1901, we provide the marginal-runs calculations and totals in Table 9.2.
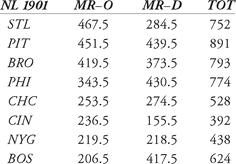
Table 9.2 Marginal runs calculations for the NL, 1901
Marginal runs produce a prediction for winning percentage that is virtually identical to the Pythagorean Number. It allows for the marginal-runs concept to be the foundation for the win-shares method.
For the 1901 NL, the marginal-runs total is divided by twice the league average in runs scored. In 1901, the teams of the NL scored 5194 runs, which translates to an average of 649.25 for each team.
Dividing each team’s marginal-runs total by 1298.5 gives a projected winning percentage, which, as in the Pythagorean Number, can be multiplied by the number of games played to arrive at a projected number of wins. Table 9.3 shows the projected wins for each team using each method.
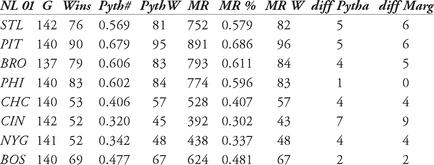
Table 9.3 Comparison of actual wins, Pythagorean projection wins, and marginal-runs projection wins for NL, 1901
Even though the marginal-runs projected number of wins is no better than that of the Pythagorean projection (and, in some cases, significantly worse), there is a trade-off: marginal runs can be computed for each player using the ratio of marginal runs to wins. The normal ratio is approximately 9 to 1, regardless if the team is a good one or a bad one, although that number can vary. In 1901, for example, Cincinnati had 52 wins and 392 marginal runs (7.5:1), but the Reds outplayed their Pythagorean projection by 7 wins and their marginal-runs win projection by 9. Obviously, something was going on there. All the other teams were roughly within one of 9 (farthest away: Brooklyn 793 / 79 = 10.03).
Thus, using runs created, we can determine how many runs a player creates, separate out the marginal runs, and then, knowing the ratio of runs to wins, calculate the wins for each player. For pitchers, runs saved by an individual can be computed and then again, transformed into wins.
Win-Shares CalculationIn order to calculate win shares for a team, we will use the so-called “short form method” that James introduced in the
Win Shares
book. The long-form method is much more complicated, involving many more calculations and data, some of which is not readily available. We can compare the numbers we compute for the 1901 Phillies with the numbers James published in his book, which were obtained using the long-form method.
According to James, the short-form method seems to yield a value very close to that of the long form for years after 1920, and is fairly close to the long form for years prior to 1920.
Here is how to compute offensive win shares using the short form:
• Compute the outs made by each hitter
• Divide the outs by 12
• Subtract from the RC
• Divide by 3. If non-negative, then this is each hitter’s batting WS
• If pitchers bat, repeat the process but don’t subtract the outs
Thus, for the 1901 Phillies, we first compute the players’ runs created, using the appropriate formula (for 1901, it is HDG-9).
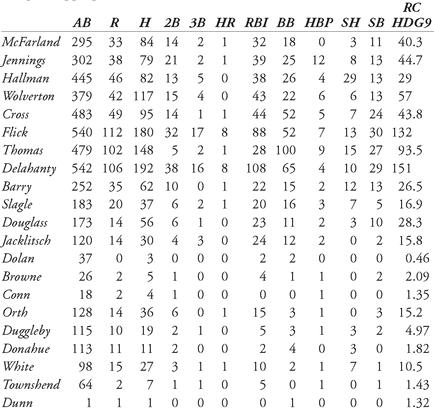
Table 9.4 Runs-created calculations for all batters (including pitchers), 1901 Phillies
Then, for each non-pitcher, we calculate the number of outs made as a hitter. That would be, for the data available for NL 1901, AB-H + SH. This total is then divided by 12 and subtracted from the player’s runs created total.
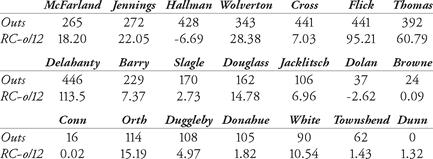
Table 9.5 Outs and runs created minus outs divided by 12 for non-pitchers, 1901 Phillies
Note that if a player’s total is negative, he is assigned a value of zero for the next calculation. Also, there is no subtraction of “outs/12” for the pitchers as hitters (in the table, from Orth and down).
Finally, this total is divided by 3 to determine batting win shares. The results are here:
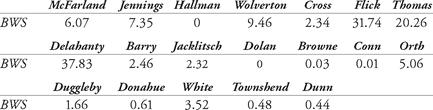
Table 9.6 Batting win shares for the 1901 Phillies
This totals about 137 batting win shares for the 1901 Phillies. Note that a negative batting-win-shares total is entered as zero.
Using James’ guideline of 48 percent of available wins shares for batters, we would need to assign 0.48 × 249, or approximately 119, of the win shares for offense. Our win-shares total of 137 is approximately 15 percent too high. However, an across-the-board 15 percent decrease per person would, with rounding-off, make the team’s total too low.
In his calculation, using the long form, James assigned a total of 107 of the 1901 Phillies’ win shares for batting. This is roughly 43 percent, not 48 percent. One reason is that the Phillies played in a hitters’ park in 1901, inflating offensive statistics by 2 percent. The justification for a 5 percent reduction is not stated or clear.
We chose a reduction of 12.5 percent per player, and after rounding off, Table 9.7 shows how it reads:
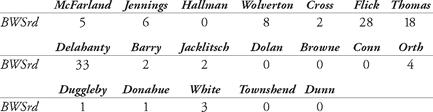
Table 9.7 Batting win shares, 1901 Phillies, reduced by 12.5 percent
Other books
The Grand Finale by Janet Evanoich
You Can Call Me Lucky (Kit Tolliver #3) (The Kit Tolliver Stories) by Block, Lawrence
Joint Enterprise (The Romney and Marsh Files Book 3) by Oliver Tidy
Commitment by Healy, Nancy Ann
The Theory of Moral Sentiments by Adam Smith, Ryan Patrick Hanley, Amartya Sen
A Root Awakening: A Flower Shop Mystery by Kate Collins
Warrior's Princess Bride by Meriel Fuller
Ricochet by Ashley Haynes
Leadville by James D. Best
A Good Marriage by Stephen King