Understanding Sabermetrics (24 page)
Read Understanding Sabermetrics Online
Authors: Gabriel B. Costa,Michael R. Huber,John T. Saccoma
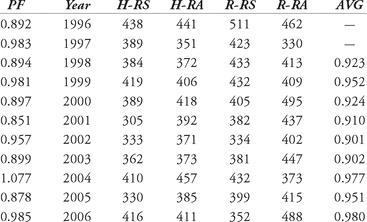
Table 10.1 The year-by-year totals, Oriole Park at Camden Yards, since 1996. (Note that the Orioles played 82 home games in 1996 and 82 road games in 2003.)
The 2004 season seems to stick out from all the others. Is it possible that a ballpark could depress runs totals by about 10 percent in one year and about 12 percent two years later, but inflate them by almost 8 percent in the year in between? Possible, sure. However, a check of
Green Cathedrals
turns up no significant alterations to Camden Yards for the 2003 season, making the sudden, temporary shift even less likely. Clearly, something is wrong with the formula. So, in an attempt to diminish the effect of one clearly anomalous season, we take a three-year average of PF. In other words, to establish a PF for a particular season, which we will call PF-3 (PF - 3 year average), we add up the PF for that season and the two previous ones, and divide by three, i.e.,

These can also be weighted further by games or innings. Thus, to establish a more accurate PF for a season, say 1999, we take


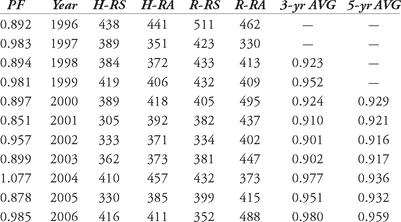
The three-year averages are shown in Table 10.2

Table 10.2 PF-3 calculations for Camden Yards since 1996.
Let us see how this can be applied to an individual player. Consider Melvin Mora, the Orioles’ third baseman in 2003. Using HDG-23, Mora had a runs-created total of 133. However, his PARC = RC + (1 - PF) × (RC)/2 = 133 + (1 - 0.899) × (133)/2 = 140. If we consider the PF-3, then PARC-3 = RC + (1 - PF-3) × (RC)/2 = 133 + (1 - 0.902) × (133)/2 = 139. Despite this fine runs-created total, Mora placed only 18th in the American League Most Valuable Player balloting for 2004.
If we choose to average the PF over a half decade (and remember, this can be weighted by games and innings as well), we create PF-5. This provides even more stability than PF-3. Table 10.3 shows PF-5 calculations for Camden Yards between 1996 and 2006.

Table 10.3 PF-5 calculations for Camden Yards since 1996
The park adjustments can shed even more light on the RC/27 statistic (see exercises, chapter 6). If we divide the runs-created total by the number
 , we obtain a figure that describes how many runs a team of 9 of a particular player might score per game. In 2003, Melvin Mora created 133 runs, using 382 outs to do it. Recall that outs are calculated by taking AB minus H and adding SH, SF and GIDP (but not CS) to that number. For 2004, Mora’s unadjusted RC yields
 while if we use PF the number is 9.02, and using PF-3 his RC/27 is 9.49. If we were to calculate his PF-5, we would see that his RC/27 would equal 9.68. This is an incredible range of difference in runs per game, and an indicator that, just maybe, Mora’s season in 2004 did not receive the degree of recognition that it deserved.
 , we obtain a figure that describes how many runs a team of 9 of a particular player might score per game. In 2003, Melvin Mora created 133 runs, using 382 outs to do it. Recall that outs are calculated by taking AB minus H and adding SH, SF and GIDP (but not CS) to that number. For 2004, Mora’s unadjusted RC yields
1. Given the raw numbers for the left fielders for the Dodgers, Mets, and Cubs in 1969, (respectively, Willie Crawford, Cleon Jones and Billy Williams), compute and adjust their runs-created totals. Use HDG-23.

2.
a. Use HDG-23 to compute the runs created for the 2006 third basemen on the Dodgers, Mets and Cubs (respectively, Aramis Ramirez, David Wright, and Wilson Betamit).
b. Apply PF from the chapter to adjust their RC numbers.
3.
a. Here are the runs scored and allowed splits for the Boston Red Sox and the Oakland A’s in 1969:Use the data to calculate the park factors for the teams that year.
b. Here are the statistics for the left fielders for those respective clubs in 1969:Using HDG-23, calculate their runs-created total for 1969.
c. Using the PF from part (a), adjust the runs-created totals of each player in part (b), using the appropriate PF.
Other books
Incidents in the Life of a Slave Girl by Ann Harriet Jacobs
When It Happens by Susane Colasanti
Twinned by Galloway, Alice Ann
Dream of Danger (A Brown and De Luca Novella) by Maggie Shayne
Mungus: Book 1 by Chad Leito
Island Idyll by Jess Dee
Crown of Ash (Blood Skies, Book 4) by Steven Montano
Loyal To The Bear (Second Chance Shifters 2) by Meredith Clarke
The Butcher of Smithfield by Susanna Gregory


