Antifragile: Things That Gain from Disorder (53 page)
Read Antifragile: Things That Gain from Disorder Online
Authors: Nassim Nicholas Taleb
I use the term “convexity effect” for both, in order to simplify the vocabulary, saying “positive convexity effects” and “negative convexity effects.”
Why does asymmetry map to convexity or concavity? Simply, if for a given variation you have more upside than downside and you draw the curve, it will be convex; the opposite for the concave.
Figure 12
shows the asymmetry reexpressed in terms of nonlinearities. It also shows the magical effect of mathematics that allowed us to treat steak tartare, entrepreneurship, and financial risk in the same breath: the convex graph turns into concave when one simply puts a minus sign in front of it. For instance, Fat Tony had the exact opposite payoff than, say, a bank or financial institution in a certain transaction: he made a buck whenever they lost one, and vice versa. The profits and losses are mirror images of each other at the end of the day, except that one is the minus sign times the other.
Figure 12
also shows why the convex
likes volatility
. If you earn more than you lose from fluctuations, you want a lot of fluctuations.
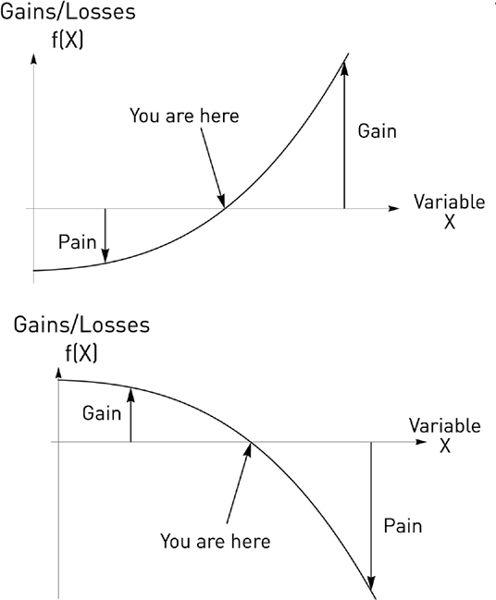
FIGURE 12.
Pain More than Gain, or Gain More than Pain. Assume you start from the “You Are Here” spot. In the first case, should the variable
x
increase, i.e., move to the right on the horizontal axis, the gains (vertical axis) are larger than the losses encountered by moving left, i.e., an equivalent decrease in the variable
x
. The graph illustrates how positive asymmetry (first graph) turns into convex (inward) curving and negative asymmetry (second graph) turns into concave (outward) curving. To repeat, for a set deviation in a variable, in equivalent amounts in both directions, the convex gains more than it loses, and the reverse for the concave.
Now the idea that has inhabited me all my life—I never realized it could show so clearly when put in graphical form.
Figure 13
illustrates the effect of harm and the unexpected. The more concave an exposure, the more harm from the unexpected, and disproportionately so. So very large deviations have a disproportionately larger and larger effect.
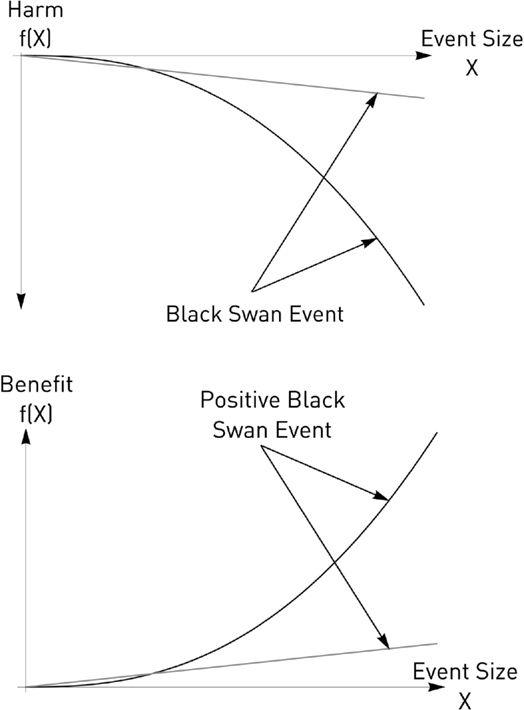
FIGURE 13.
Two exposures, one linear, one nonlinear, with negative convexity—that is, concavity—in the first graph, positive convexity in the second. An unexpected event affects the nonlinear disproportionately more. The larger the event, the larger the difference.
Next, let us apply this very simple technique to the detection of fragility and position in the Triad.
Let us apply “convexity effects” to things around us. Traffic is highly nonlinear. When I take the day flight from New York to London, and I leave my residence around five in the morning (yes, I know), it takes me around 26 minutes to reach the British Air terminal at JFK airport. At that time, New York is empty, eerily non–New York. When I leave my place at six o’clock for the later flight, there is almost no difference in travel time, although traffic is a bit denser. One can add more and more cars on the highway, with no or minimal impact on time spent in traffic.
Then, a mystery—increase the number of cars by 10 percent and watch the travel time jump by 50 percent (I am using approximate numbers). Look at the convexity effect at work: the average number of cars on the road does not matter at all for traffic speed. If you have 90,000 cars for one hour, then 110,000 cars for another hour, traffic would be much slower than if you had 100,000 cars for two hours. Note that travel time is a negative, so I count it as a cost, like an expense, and a rise is a bad thing.
So travel cost is fragile to the
volatility
of the number of cars on the highway; it does not depend so much on their average number. Every additional car increases travel time more than the previous one.
This is a hint to a central problem of the world today, that of the misunderstanding of nonlinear response by those involved in creating “efficiencies” and “optimization” of systems. For instance, European airports and railroads are stretched, seeming overly efficient. They operate at close to maximal capacity, with minimal redundancies and idle capacity, hence acceptable costs; but a small increase in congestion, say 5 percent more planes in the sky owing to a tiny backlog, can give rise to chaos in airports and cause scenes of unhappy travelers camping on floors, their only solace some bearded fellow playing French folk songs on his guitar.
We can see applications of the point across economic domains: central banks can print money; they print and print with no effect (and claim the “safety” of such a measure), then, “unexpectedly,” the printing causes a jump in inflation. Many economic results are completely canceled by convexity effects—and the happy news is that we know why. Alas, the tools (and culture) of policy makers are based on the overly linear, ignoring these hidden effects. They call it “approximation.”
When you hear of a “second-order” effect, it means convexity is causing the failure of approximation to represent the real story.
I have put a (very hypothetical) graph of the response of traffic to cars on the road in
Figure 14
. Note for now the curved shape of the graph. It curves inward.
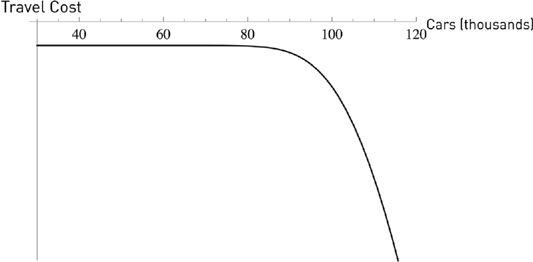
FIGURE 14.
The graph shows how the author’s travel time (and travel costs) to JFK depend, beyond a certain point, nonlinearly on the number of cars on the road. We show travel costs as curving inward—concave, not a good thing.
An apt illustration of how convexity effects affect an overoptimized system, along with misforecasting large deviations, is this simple story of an underestimation made by New York City officials of the effect of a line closure on traffic congestion. This error is remarkably general: a small modification with compounded results in a system that is extremely stretched, hence fragile.
One Saturday evening in November 2011, I drove to New York City to meet the philosopher Paul Boghossian for dinner in the Village—typically a forty-minute trip. Ironically, I was meeting him to talk about my book, this book, and more particularly, my ideas on redundancy in systems. I have been advocating the injection of redundancy into people’s lives and had been boasting to him and others that, since my New Year’s resolution of 2007, I have never been late to anything, not even by a minute (well, almost). Recall in
Chapter 2
my advocacy of redundancies as an aggressive stance. Such personal discipline forces me to build buffers, and, as I carry a notebook, it allowed me to write an entire book of aphorisms. Not counting long visits to bookstores. Or I can sit in a
café and read hate mail. With, of course, no stress, as I have no fear of being late. But the greatest benefit of such discipline is that it prevents me from cramming my day with appointments (typically, appointments are neither useful nor pleasant). Actually, by another rule of personal discipline I do not make appointments (other than lectures) except the very same morning, as a date on the calendar makes me feel like a prisoner, but that’s another story.
As I hit Midtown, around six o’clock, traffic stopped. Completely. By eight I had moved hardly a few blocks. So even my “redundancy buffer” failed to let me keep the so-far-unbroken resolution. Then, after relearning to operate the noisy cacophonic thing called the radio, I started figuring out what had happened: New York City had authorized a film company to use the Fifty-ninth Street Bridge, blocking part of it, assuming that it would be no problem on a Saturday. And the small traffic problem turned into mayhem, owing to the multiplicative effects. What they felt would be at the worst a few minutes’ delays was multiplied by two orders of magnitude; minutes became hours. Simply, the authorities running New York City did not understand nonlinearities.
This is the central problem of efficiency: these types of errors compound, multiply, swell, with an effect that only goes in one direction—the wrong direction.
Another intuitive way to look at convexity effects: consider the scaling property. If you double the exposure to something, do you more than double the harm it will cause? If so, then this is a situation of fragility. Otherwise, you are robust.
The point has been aptly expressed by P. W. Anderson in the title of his paper “More Is Different.” And what scientists involved in complexity call “emerging properties” is the nonlinear result of adding units, as the sum becomes increasingly different from the parts. Just look at how different the large stone is from the pebbles: the latter have the same weight and the same general shape, but that’s about it. Likewise, we saw in
Chapter 5
that a city is not a large village; a corporation is not a larger small business. We also saw how randomness changes in nature from Mediocristan to Extremistan, how a state is not a large village, and
many alterations that come from size—and speed. All these show nonlinearity in action.
Another example of missing the hidden dimension, that is, variability: we are currently told by the Soviet-Harvard U.S. health authorities to eat set quantities of nutrients (total calories, protein, vitamins, etc.) every day, in some recommended amounts of each. Every food item has a “percentage daily allowance.” Aside from the total lack of empirical rigor in the way these recommendations are currently derived (more on that in the medical chapters), there is another sloppiness in the edict: an insistence in the discourse on the
regularity
. Those recommending the nutritional policies fail to understand that “steadily” getting your calories and nutrients throughout the day, with “balanced” composition and metronomic regularity, does not necessarily have the same effect as consuming them unevenly or randomly, say by having a lot of proteins one day, fasting completely another, feasting the third, etc.
This is a denial of hormesis, the slight stressor of episodic deprivation. For a long time, nobody even bothered to try to figure out whether variability in distribution—the second-order effect—mattered as much as long-term composition. Now research is starting to catch up to such a very, very simple point. It turns out that the effect of variability in food sources and the nonlinearity in the physiological response is central to biological systems. Consuming no protein at all on Monday and catching up on Wednesday seemingly causes a different—better—physiological response, possibly because the deprivation, as a stressor, activates some pathways that facilitate the subsequent absorption of the nutrients (or something similar). And, until a few recent (and disconnected) empirical studies, this convexity effect has been totally missed by science—though not by religions, ancestral heuristics, and traditions. And if scientists get some convexity effects (as we said about domain dependence, doctors, just like weight lifters, understand here and there nonlinearities in dose response), the notion of convexity effects itself appears to be completely missing from their language and methods.