Antifragile: Things That Gain from Disorder (82 page)
Read Antifragile: Things That Gain from Disorder Online
Authors: Nassim Nicholas Taleb
Nothing is open-ended in nature—death is a maximum outcome for a unit. So things end up convex on one end, concave on the other.
In fact, there is maximum harm at some point in things biological. Let us revisit the concave figure of the stone and pebbles in
Chapter 18
: by widening the range we see that boundedness of harm brings convexities somewhere. Concavity was dominant, but local.
Figure 28
looks at the continuation of the story of the stone and pebbles.
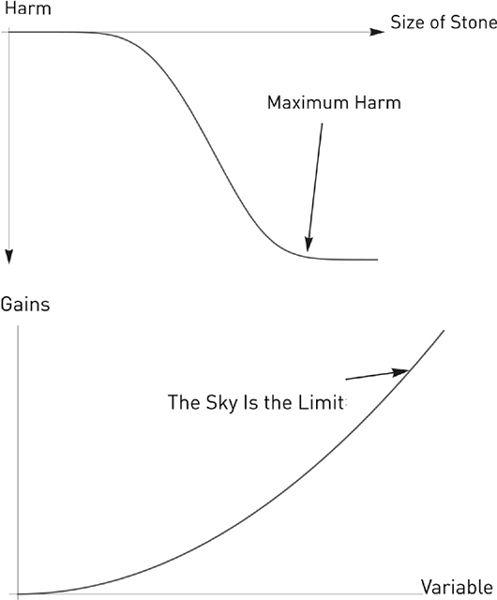
FIGURE 28
.
The top graph shows a broader range in the story of the stone and pebbles in
Chapter 18
. At some point, the concave turns convex as we hit maximum harm. The bottom graph shows strong antifragility, with no known upper limit (leading to Extremistan). These payoffs are only available in economic variables, say, sales of books, or matters unbounded or near-unbounded. I am unable to find such an effect in nature.
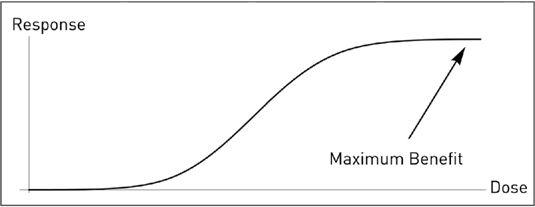
FIGURE 29
.
Weak Antifragility (Mediocristan), with bounded maximum.
Typical in nature.
The next two types of nonlinearities are almost never seen outside of economic variables; they are particularly limited to those caused by derivatives.
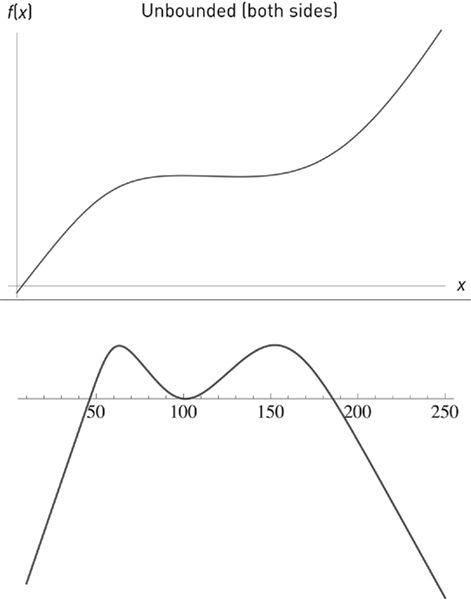
FIGURE 30
.
The top graph shows a convex-concave increasing function, the opposite of the bounded dose-response functions we see in nature. It leads to Type 2, Fragile (very, very fat tails). The bottom graph shows the most dangerous of all: pseudoconvexity. Local antifragility, global fragility.
CHAPTERS 21
&
22
)
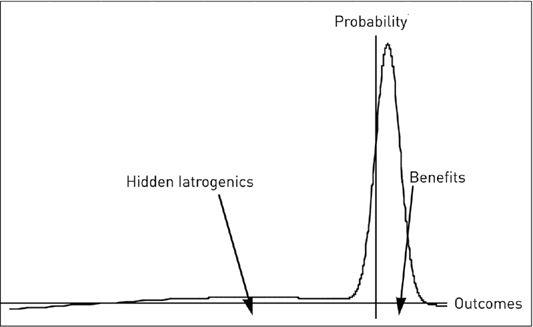
FIGURE 31
.
Medical Iatrogenics:
Case of small benefits and large Black Swan–style losses seen in probability space. Iatrogenics occurs when we have small identifiable gains (say, avoidance of small discomfort or a minor infection) and exposure to Black Swans with delayed invisible large side effects (say, death). These concave benefits from medicine are just like selling a financial option (plenty of risk) against small tiny immediate gains while claiming “evidence of no harm.”
In short, for a healthy person, there is a small probability of disastrous outcomes (discounted because unseen and not taken into account), and a high probability of mild benefits.
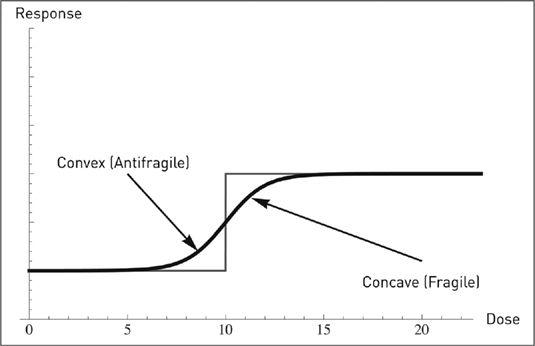
FIGURE 32
.
Nonlinearities in biology.
The shape convex-concave necessarily flows from anything increasing (monotone, i.e., never decreasing) and bounded, with maximum and minimum values, i.e., does not reach infinity from either side. At low levels, the dose response is convex (gradually more and more effective). Additional doses tend to become gradually ineffective or start hurting. The same can apply to anything consumed in too much regularity. This type of graph necessarily applies to any situation bounded on both sides, with a known minimum and maximum (saturation), which includes happiness.
For instance, if one considers that there exists a maximum level of happiness and unhappiness, then the general shape of this curve with convexity on the left and concavity on the right has to hold for happiness (replace “dose” with “wealth” and “response” with “happiness”). Kahneman-Tversky prospect theory models a similar shape for “utility” of changes in wealth, which they discovered empirically.
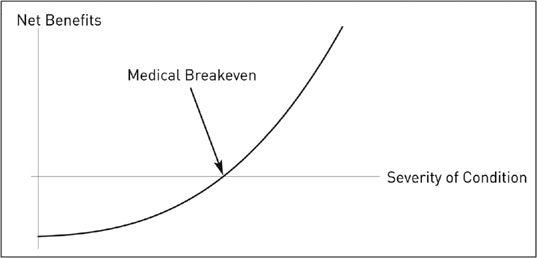
FIGURE 33
.
Recall the hypertension example. On the vertical axis, we have the benefits of a treatment, on the horizontal, the severity of the condition. The arrow points at the level where probabilistic gains match probabilistic harm. Iatrogenics disappears nonlinearly as a function of the severity of the condition. This implies that when the patient is very ill, the distribution shifts to antifragile (thicker right tail), with large benefits from the treatment over possible iatrogenics, little to lose.
Note that if you increase the treatment you hit concavity from maximum benefits, a zone not covered in the graph—seen more broadly, it would look like the preceding graph.
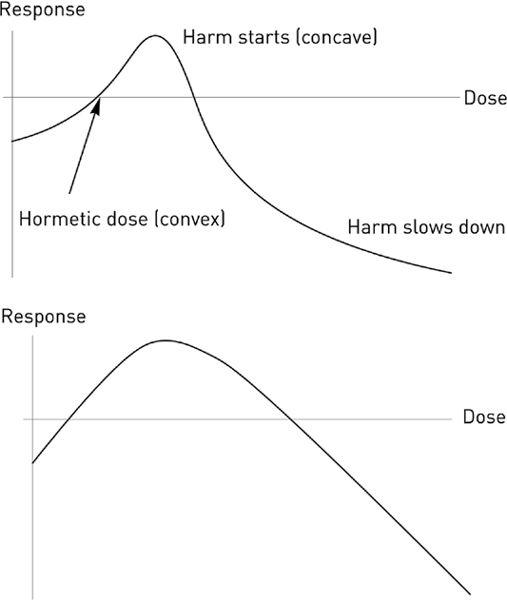
FIGURE 34
.
The top graph shows hormesis for an organism (similar to
Figure 19
): we can see a stage of benefits as the dose increases (initially convex) slowing down into a phase of harm as we increase the dose a bit further (initially concave); then we see things flattening out at the level of maximum harm (beyond a certain point, the organism is dead so there is such a thing as a bounded and known worst case scenario in biology). To the right, a wrong graph of hormesis in medical textbooks showing initial concavity, with a beginning that looks linear or slightly concave.
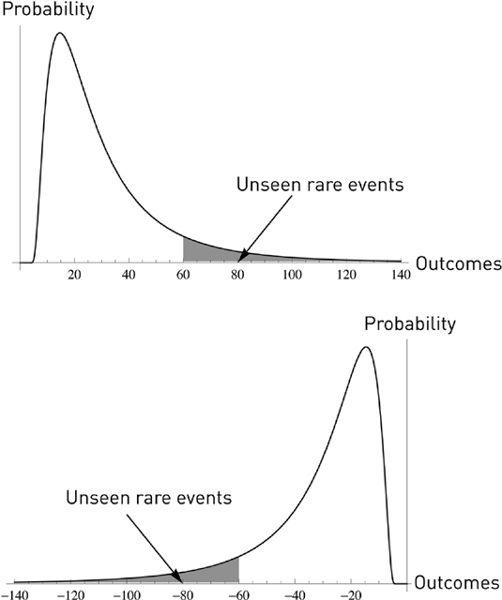
FIGURE 35
.
Antifragile, Inverse Turkey Problem:
The unseen rare event is positive. When you look at a positively skewed (antifragile) time series and make inferences about the unseen, you miss the good stuff and underestimate the benefits (the Pisano, 2006a, 2006b, mistake). On the bottom, the other Harvard problem, that of Froot (2001). The filled area corresponds to what we do not tend to see in small samples, from insufficiency of points. Interestingly the shaded area increases with model error. The more technical sections call this zone ω
B
(turkey) and ω
C
(inverse turkey).