Understanding Sabermetrics (14 page)
Read Understanding Sabermetrics Online
Authors: Gabriel B. Costa,Michael R. Huber,John T. Saccoma
Notice that the last term in the formula is actual earned runs allowed, not the earned run average. Pitching runs provides a difference of earned runs allowed at a league average, for the given number of innings pitched, and actual earned run allowed. Let’s calculate Clemens’ pitching runs for 2005:
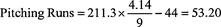
This shows that Roger Clemens was 53.2 runs better than the average National League pitcher in 2005. Using the accepted notion that ten runs equates to a win, Clemens would have turned an average 81-81 National League team into a team with a record of 86-76. (The Astros finished the 2005 regular season at 89-73). There is a second formula for pitching runs that rearranges terms:

Substituting Clemens’ 2005 numbers yields:
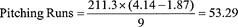
This second formula, involving only innings pitched and earned run averages, is best employed when evaluating the performance of pitchers for whom the number of earned runs is not available, but the ERA is known. Notice the slight error in the two approaches; round-off error for the two ERAs can lead to a slight disagreement in pitching-run values.
In 2001, Roger Clemens won his unprecedented sixth Cy Young Award. The voting was not close. The New York Yankees’ Clemens picked up 21 of 28 first-place votes, and his total number of points was twice as much as the next vote-getter, the Oakland Athletics’ Mark Mulder. Did Roger win a sixth because he already had five? Was he the best pitcher in the American League, relative to other pitchers? Let’s compare the six pitchers who received votes for the AL Cy Young Award in 2001. They are listed in the order of voting points finish in Table 7.1. The league ERA was 4.48.
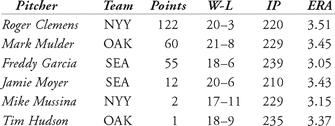
Table 7.1 Cy Young Award voting finish, 2001
At first glance, the earned run averages of the six pitchers are comparable, although Freddie Garcia had close to a half run smaller ERA than Clemens. Innings pitched are also similar. Clemens’ won-lost record was astonishing (almost 87 percent), but Jamie Moyer also had a great season. Using the second pitching runs (PR) formula, we determine the following:
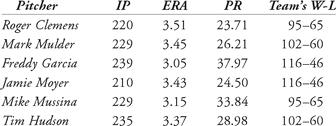
Table 7.2 AL pitching runs, 2001
Of the six pitchers receiving votes, Clemens has the lowest pitching-runs value. That equates to the fewest wins afforded to his team. Did his won-lost record push him that far ahead of his rivals? Should he have received the Cy Young Award? Freddie Garcia earned over 14 more pitching runs, which equates to about one and a half more wins for his team. The Mariners sailed to a record 116 victories in 2001.
Let’s inspect the data further. Compare Clemens with his teammate Mike Mussina, who had ten more pitching runs. Mussina pitched 8 more innings than Clemens, but he allowed six fewer earned runs. Not shown is the fact that Mussina had four complete games, including three shutouts, in 2001, while Clemens had none of each. Opponents batted .237 against Mussina while hitting .246 against Clemens. Clemens did receive a higher run support from the Yankees when he pitched, and Mussina did offer one more win for the Yankees from his pitching runs than did Clemens. The vote is in the history books, but sabermetricians can ponder the 2001 Cy Young Award vote using linear weights.
Thorn and Palmer incorporate efficiency and durability into their pitching-runs formula. If a pitcher is consistently better than average, his team will benefit more and his linear-weights pitching-runs value will be higher. For example, if a pitcher is allowing one less earned run per game than the average pitcher, his pitching-runs total will increase with more innings pitched. One problem emerges, however. If we look at
Baseball-reference. com
’s listing of the single-season leaders for innings pitched (IP), we will notice that the top 100 on that listing are all players who pitched before 1901. At the very top of the list is Will White, with 680 innings in 1879. Down at number 100 is Gus Weyhing at 469⅔ innings in 1892. The 1918 Chicago Cubs’ Hippo Vaughn was the first pitcher to lead either league in innings pitched with a total under 300 innings (290⅓). The last pitcher to pitch over 300 innings in a season was Philadelphia’s Steve Carlton, who had 304 innings pitched in 1980, the season the Phillies won their only World Series. No pitcher since 1980 has pitched more than 300 innings in a season. What does this mean? A pre-1900 pitcher with a mediocre ratio of earned run average to the league earned run average will amass an enormous number of pitching runs due to the large number of innings pitched. Thorn and Palmer list the ten best pitchers with pitching linear weights since 1961 in Table 7.3.
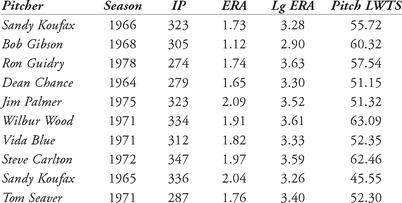
Table 7.3 Top ten in pitching runs, 1961-1984
Bob Gibson, Dean Chance, and Sandy Koufax are the only pitchers after 1916 to have more than ten shutouts in a single season. Those shutouts directly contributed to their low earned run averages, which in turn correlates to a high pitching runs value.
What about recent pitchers? Let’s compare the Cy Young Award seasons of the four winners in the American League from 2005, 1995, 1985, 1975.
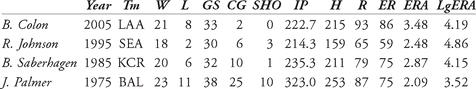
Table 7.4 Comparison of Cy Young Award winners
At first glance, Randy Johnson’s 1995 season stands out as one in which his personal ERA was almost half of the league ERA. His winning percentage was phenomenal. However, one-third of his starts resulted in a no-decision for him. Calculating the pitching runs, we find that Johnson leads these four pitchers with a pitching runs total of 56.67. Jim Palmer’s 1975 season netted 51.32 runs, followed by Bret Saberhagen’s 1985 season (33.46 runs), and Bartolo Colon’s 2005 season (only 17.57 runs). It is interesting to see that Palmer lost eleven games but still had an ERA of about two runs per game (his ten shutouts averaged out his losses).
Fielding RunsBack to Earl Weaver’s theorem for winning ballgames. After good pitching, a team should be able to execute the fundamentals of the game. Part of that involves defense. Weaver’s Baltimore Orioles teams always had players winning Gold Glove Awards for being the best at their respective defensive positions. He and other managers would sacrifice a good bat for a good glove, especially for middle infielders. Consider second basemen Davey Johnson (3 Gold Gloves, .261 BA) and Bobby Grich (4 Gold Gloves, .266 BA), shortstop Mark Belanger (8 Gold Gloves, .228 BA), third baseman Brooks Robinson (a record 16 Gold Gloves, .267 BA), center fielder Paul Blair (8 Gold Gloves, .250 BA), and pitcher Jim Palmer (4 Gold Gloves). They all flashed their leather for the Orioles. Luis Aparicio won three of his eight Gold Gloves playing shortstop for the Orioles before Belanger came along. How does this defense transform into runs? Thorn and Palmer developed a defensive-runs formula, based on linear weights.
What if each Gold Glove Award recipient was replaced with an average fielder who was a better hitter? How many runs might not be saved? Is the fielding percentage of a player the best measure for defensive skills? The linear-weights fielding-runs formula for second basemen, shortstops and third basemen involves calculating a league average for each position, followed by a rating for the team in question at each position. The Pirates’ Bill Mazeroski set the defensive runs record for infielders with 46.5 in 1963. The average position relative to the league, is given by
 where PO = putouts, A = assists, E = errors, DP = double plays, and K = strikeouts. Then the team rating is given by
Team Runs per position = 0.20 x [PO + (2 x A) - E + DP] team at position - Average position league x (team PO - team K)
Other books
Tres manos en la fuente by Lindsey Davis
Sins of a Wicked Duke by Sophie Jordan
Gina Cresse - Devonie Lace 04 - A Deadly Change of Power by Gina Cresse
A Lawman's Justice (Sweetwater Ranch Book 8) by Delores Fossen
Love Match by Maggie MacKeever
Charred by Kate Watterson
Call After Midnight by Mignon G. Eberhart
Scotched by Kaitlyn Dunnett
A Different Trade by J. R. Roberts
Swan Song (Julie O'Hara Mystery Series) by Hanson, Lee