Understanding Sabermetrics (32 page)
Read Understanding Sabermetrics Online
Authors: Gabriel B. Costa,Michael R. Huber,John T. Saccoma
It looks like Hank Greenberg contributed 7.389 wins to the Tigers in 1934.
Inning 5: The Linear Weights School — Pitching and Defense(1)
(2)
(4)
This translates to about 0.29 runs saved per nine innings for Gibson and 0.53 runs saved per nine innings for Maddux.
Hard Slider(2)
Doc Gooden’s 1985 performance ranks very high on the all-time list. Dontrelle Willis could be classified as having experienced the sophomore jinx. However, he returned to the top the next season (2005), going 22-10, with an ERA over 1.4 runs below the league average.
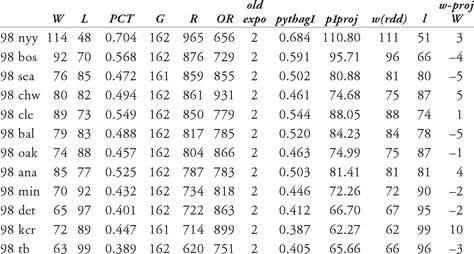
Inning 6: The Runs-Created School(1a)Texas’s projected wins based on the Pythagorean record was 87, while Toronto’s was 86.
(1b)
The Kansas City Royals won 10 games more than their projection, and the Seattle Mariners and Baltimore Orioles each won 5 games fewer than their projections.
(2)
We use basic runs created: (H + BB) × (TB) / (AB + BB) = (21276 + 7737)) × (33837) / (78416 + 7737) = 11395 (rounded). The league scored 11365, so the runs-created figure is well within half of 1 percent of the actual figure.
We use basic runs created: (H + BB) × (TB) / (AB + BB) = (21276 + 7737)) × (33837) / (78416 + 7737) = 11395 (rounded). The league scored 11365, so the runs-created figure is well within half of 1 percent of the actual figure.
(3)
Bobby Murcer in 1971:
(4)Murray seems to have created more runs, even with the adjustment
(5)
(1)
Ruth had almost twice as many runs created per game as the other sluggers.
(2)
Other books
The Accidental Slave (Aya's story Part 1) by Elin Peer
The Tilting House by Tom Llewellyn
My Best Friend and My Man by Cydney Rax
Reconstructing Meredith by Lauren Gallagher
Freakn' Cougar by Eve Langlais
Gunpowder Plot by Carola Dunn
Ransom by Lee Rowan
The Soldier by Grace Burrowes
Earthquake by Kathleen Duey
The Hornet's Sting by Mark Ryan


