Why Growth Matters (12 page)
Read Why Growth Matters Online
Authors: Jagdish Bhagwati
There is little doubt that India has some ways to go in the area of health. But this requires a realistic assessment of both achievements and failures. If income increases have indeed helped in improving health outcomes, this needs to be recognized. Otherwise we would erroneously conclude that income increases are not crucial to improving human welfare after all.
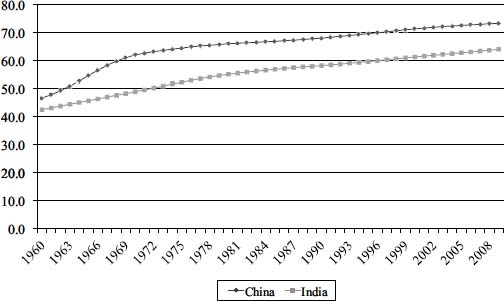
Figure 5.2. Life expectancy in India and China, 1960â2009
Source: Based on the data from World Development Indicators of the World Bank
.
There is constant repetition by Indian as well as foreign-based civil society groups, journalists, international institutions, bloggers, and even academics that India suffers from the worst malnutrition anywhere in the world. Some also contend that the country is making no progress in bringing down malnutrition. This is the latest illusion to which the critics of Indian reforms are clinging.
As a representative example, a blog post by Meg Towle on the website of Columbia University's Earth Institute asks, “India is boomingâso why are nearly half of its children malnourished?” Towle opens the article thus: “India has more hungry peopleâand the highest burden of child malnutritionâthan any country in the world. The 2010 Global Hunger Index designates national levels of hunger as
alarming
, and India scores lower than many Sub-Saharan African countries despite having a considerably higher GDP.” She adds, “The percentage of children under age three who are underweight has virtually not changed between 1998â1999 and 2005â2006, hovering under 50%.”
6
Nutrition among children as well as adults is indeed an important and urgent problem in India. This being said, addressing it effectively also requires proper analysis. To date, however, rhetoric and journalistic assertions such as Towle's, which unfortunately are carried on websites of institutions that claim to be scientific but fall short in practice, and resort to dubious indices, have filled the public policy space, misleading many. Our critique below shows why.
Child nutrition
. There are very serious measurement issues with translating the heights and weights of children into stunting (low height for age) and underweight (low weight for age).
7
Before we discuss them, however, it is useful to consider the evidence, such as there is, being utilized to reach judgments on the issue.
Recall that health as an objective received ample attention from the beginning of development planning in India. Nutrition, within health, was no exception: the First Five-Year Plan (1951â1956) devoted a sub
stantial separate section to it. More important, India is perhaps the only developing country where systematic and comparable surveys at regular intervals aimed at measuring nutrition among children as well as adults have been conducted since the 1970s.
As early as 1972, the Indian Council of Medical Research, Hyderabad, had established the National Nutritional Monitoring Bureau (NNMB), which has conducted regular nutrition surveys of rural populations in nine states. The NNMB surveys provide comparable nutrition indicators for 1975â1979, 1988â1990, 1996â1997, and 2003â2006.
Figure 5.3
depicts the evolution of the proportions of the underweight and stunted children between ages one and five years according to these surveys. The estimates are based on pooled observations from all nine NNMB states. We cannot overemphasize the fact that both measures show a
steady improvement
in child nutrition status, contrary to Meg Towle's claim (though that improvement is consistent with India's still showing exceptionally high levels of malnutrition, a separate issue where Towle chides India and which we address below).
Evidence from a more recent comprehensive source, the National Family Health Survey (International Institute for Population Sciences and Macro International 2007), corroborates the trend indicated by the NNMB estimates. This newer source covers virtually all states and rural as well as urban areas, and has conducted three rounds of surveys, in 1992â1993, 1998â1999, and 2005â2006. Comparable child nutrition estimates are available for children under three years of age for 1998â1999 and 2005â2006. It turns out that the proportion of stunted children fell from 51 percent to 45 percent and that of underweight children from 43 percent to 40 percent between these two periods.
The decline in malnutrition notwithstanding, it is the high absolute level of malnutrition that has grabbed media headlines. Not a day goes by without some TV channel or newspaper running the headline that the world's fastest-growing economy suffers worse malnutrition than sub-Saharan Africa. Journalists, NGOs, politicians, and international institutions within and outside India have all accepted these levels entirely uncritically.

Figure 5.3. Malnourishment among children above one and below five years of age in rural areas of nine states
Source: Authors' construction based on NNMB (1999), Report of Second Repeat SurveyâRural, Indian Council of Medical Research, Hyderabad, Table 19, and NNMB Fact Sheet 2003â06 at
www.nnmbindia.org/downloads.html
(accessed June 27, 2011)
But first consider India in relation to sub-Saharan Africa (SSA). In terms of vital statistics, such as life expectancy at birth, infant mortality, and maternal mortality, India fares better than all except one or two SSA countries with comparable or lower per capita incomes. So it is puzzling that according to WHO statistics, the country suffers from a higher proportion of underweight children than every one of the forty-eight SSA countries and a higher rate of stunting than all but seven of them. Such countries as Central African Republic, Chad, and Lesotho, which have life expectancy at birth of just forty-eight years compared with India's sixty-five, have lower rates of stunting and underweight!
To further underline the obvious absurdity of the malnutrition numbers for India, compare Kerala and Senegal. Kerala exhibits vital statistics edging toward those in the developed countries: life expectancy of 74 years, infant mortality rate of 12 per 1,000 live births, under-five mortality of 16 per 1,000 live births, and maternal mortality
rate of 95 per 100,000 live births. The corresponding figures for Senegal are far worse at 62, 51, 93, and 410, respectively. But nutrition statistics say that Kerala has 25 percent stunted children compared to 20 percent of Senegal, and 23 percent underweight children relative to 14.5 percent of the latter. How is it possible that the better-nourished infants and children of Senegal respectively die at rates 4.25 and 5.8 times those of Kerala? Likewise, does it make sense that Senegalese mothers giving birth to healthier children die at rates 4.3 times those of Kerala mothers during childbirth?
To make sense of this nonsense, we must look elsewhere. Specifically, we need to examine how the stunting rates are calculated (the procedure for determining underweight children is identical). To classify a child of a given age and sex as stunted, we must compare his or her height to a prespecified standard, set by WHO. In the early 2000s, WHO collected a sample of 8,440 children representing a population of healthy breastfed infants and young children in Brazil, Ghana, India, Norway, Oman, and the United States. This “reference” population provided the basis for setting the standards.
As expected, when comparing children of a given age and sex even within this healthy sample, heights and weights differed due to genetic differences. Therefore, some criterion was required to identify stunting among these children. In each group, identified by age and sex, WHO defined the bottom 2.14 percent of the children according to height as stunted. The height of the child at 2.14 percentile then became the standard against which children of the same age and sex in other populations were to be compared to identify stunting. An identical procedure was used to set the standard for identifying underweight children.
The key assumption underlying this methodology is that
if properly nourished
, all child populations would produce outcomes identical to the WHO reference population, with only 2.14 percent of the children at the bottom remaining stunted and underweight. Higher rates of stunting would indicate above-normal malnutrition. So the million-dollar question is whether this assumption really holds for the population of children from which the estimate of half of Indian children being stunted is derived.
As it happens, the answer can be found buried in a recent study published by the Government of India (2009a). The latest estimate for stunting in India has been derived from the third National Family Health Survey (NFHS-3), mentioned earlier. The report draws a highly restricted sample from the fuller NFHS-3 sample consisting of
elite
children defined as those “whose mothers and fathers have secondary or higher education, who live in households with electricity, a refrigerator, a TV, and an automobile or truck, who did not have diarrhea or a cough or fever in the two weeks preceding the survey, who were exclusively breastfed if they were less than five months old, and who received complementary foods if they were at least five months old” (Government of India 2009, p. 10).
If the assumption that proper nutrition guarantees the same outcome in every population as in the WHO reference population is valid, the proportion of stunted children in this sample should be 2.14 percent. But the study reports this proportion as above 15 percent. The assumption is violated by a wide margin.
The implication of this and other facts is that Indian children are genetically smaller on average. A competing hypothesis, which says that nutrition improvements may take several generations, fails to explain how, without a genetic advantage, the far poorer sub-Saharan African countries, which lag behind India in almost all vital statistics, could have pulled so far ahead of India in child nutrition. Moreover, the trend of the stunting proportions shown in
Figure 5.3
would suggest that nearly all those born in the 1950s and before are stunted. This is as absurd as it gets.
We note here with some puzzlement the uneven treatment of child malnutrition by the prominent activist economist Jean Drèze in his different writings. Thus, in an article in the
Economic and Political Weekly
(Deaton and Drèze 2009), Drèze discusses at length the finding that even the elite Indian children fail to attain the high nutrition levels exhibited by the WHO 2006 population. Yet, when writing in
Outlook
magazine on the same issue, he makes no mention whatsoever of the qualifications this finding implies (Drèze and Sen 2011). In the latter article, the authors begin with two opposite narratives of the post-reform India, a
brighter one based on accelerated growth and a gloomy one rooted in poor performance in education and health. In articulating the gloomy narrative, the authors regurgitate the malnutrition indicators that place India below nearly all sub-Saharan African countries without indicating any of the qualifications discussed in Deaton and Drèze (2009).
Adult Nutrition
. The story told by the critics about adult malnutrition (as distinct from child malnutrition) is equally suspect. The source of alarm here is the steady decline in per capita calorie consumption in rural India with no clear trend in urban India during the past twenty-five years. Deaton and Drèze (2008), who provide a comprehensive survey of the evidence, point to per capita calorie consumption and the proportion of the population reporting lack of food as sending conflicting signals on hunger. On the one hand, per capita calorie consumption fell from 2,240 in 1983 to between 2,000 and 2,100 in the first half of the 2000s. On the other hand, the proportion of those reporting lack of food fell from 17.3 percent in 1983 to just 2.5 percent in 2004â2005. In addition, per capita protein consumption has declined while per capita fat consumption has risen in both rural and urban areas.
There are several possible explanations for the decline in calorie consumption while the proportion of the population reporting lack of food drops dramatically. One is that increased mechanization in agriculture, improved means of transportation, and improved absorption due to improved epidemiological environment (better child and adult health and better access to safe drinking water) have curtailed the need for calorie consumption. Another possible explanation is a shift from coarse grains, such as millet and sorghum, which are calorie intensive, to finer ones, such as rice and fruits.