Ancient DNA: Methods and Protocols (42 page)
Read Ancient DNA: Methods and Protocols Online
Authors: Beth Shapiro
If desired, use the samtools fl agstat command to obtain simple alignment statistics for each BAM fi le. Use the GNU command line tool, grep, to limit the output to report the percentage of mapped reads:
Based on these results, the samples have on average 4.03%
endogenous DNA. However, some samples have as little as 0.01%
and others have up to 44.09%. Here, we chose to count the number of aligned reads including all sequences regardless of their length.

23 Analysis of High-Throughput Ancient DNA Sequencing Data 217
Short, merged sequences may, however, result in erroneous
alignments. Consequently, we should apply a lower length cutoff for analysis.
Using the samtools
view
command and the GNU tool awk, fi lter for aligned sequences of at least 30 nt and recalculate the percentage aligned:
The results with the lower length cutoff are very similar: 4.25%
endogenous DNA (minimum 0.01%, maximum 44.09%). Here,
50 out of 96 samples show at least 0.5% endogenous DNA.
3.6. Quantifying
Contaminant sequences are those that are identifi ed as endogenous
Contamination
but do not originate from the sample itself. Contaminants may be introduced from various sources, including the burial or preservation environment, people handling the sample, and laboratory chemicals. Ideally, contaminated samples should not be used for analysis. When this is not possible, however, additional steps are required. A type of negative fi ltration, in which sequence reads that more closely match the putative contaminant than the target sequence are excluded, has been suggested (e.g., see r
ef. ( 62 )
).
This approach is likely to be problematic when sequences are short and/or the evolutionary distance between the putative contaminant and the sample is small.
Contamination is particularly problematic in aDNA studies of early modern humans, Neandertals, and closely related primates.
Here, the proportion of endogenous reads that can be attributed to contaminants is usually estimated by examining informative sites,
i.e.
sites where sequence differences are known to be fi xed and distinct between the contaminant and the sample
( 8, 13,
28 )
.
Once the amount of contamination in a sample is known, this information can be incorporated within statistical models during data analysis. If no informative sites are known, estimates of contamination may be obtained by surveying the amount of “extra”
polymorphism, such as biallelic sites in haploid sequences or trial-lelic sites in diploid sequences. Finally, any Y chromosomal
218
M. Kircher
fragments in a female sample are most likely due to the presence of contaminant male DNA in the sample
( 8,
63 )
.
For larger evolutionary distances, an estimate of the proportion of sequence reads that are contaminants may be obtained by attempting to align each sequence to a set of closely related reference sequences and a set of homologous contaminant sequences, and by comparing their alignment scores. Here, semi-global alignments scoring higher for the contaminants are counted as contamination, while those scoring higher for the set of close reference sequences are considered to be endogenous. Alignments that score equally are considered to be uninformative, and are excluded from the estimate.
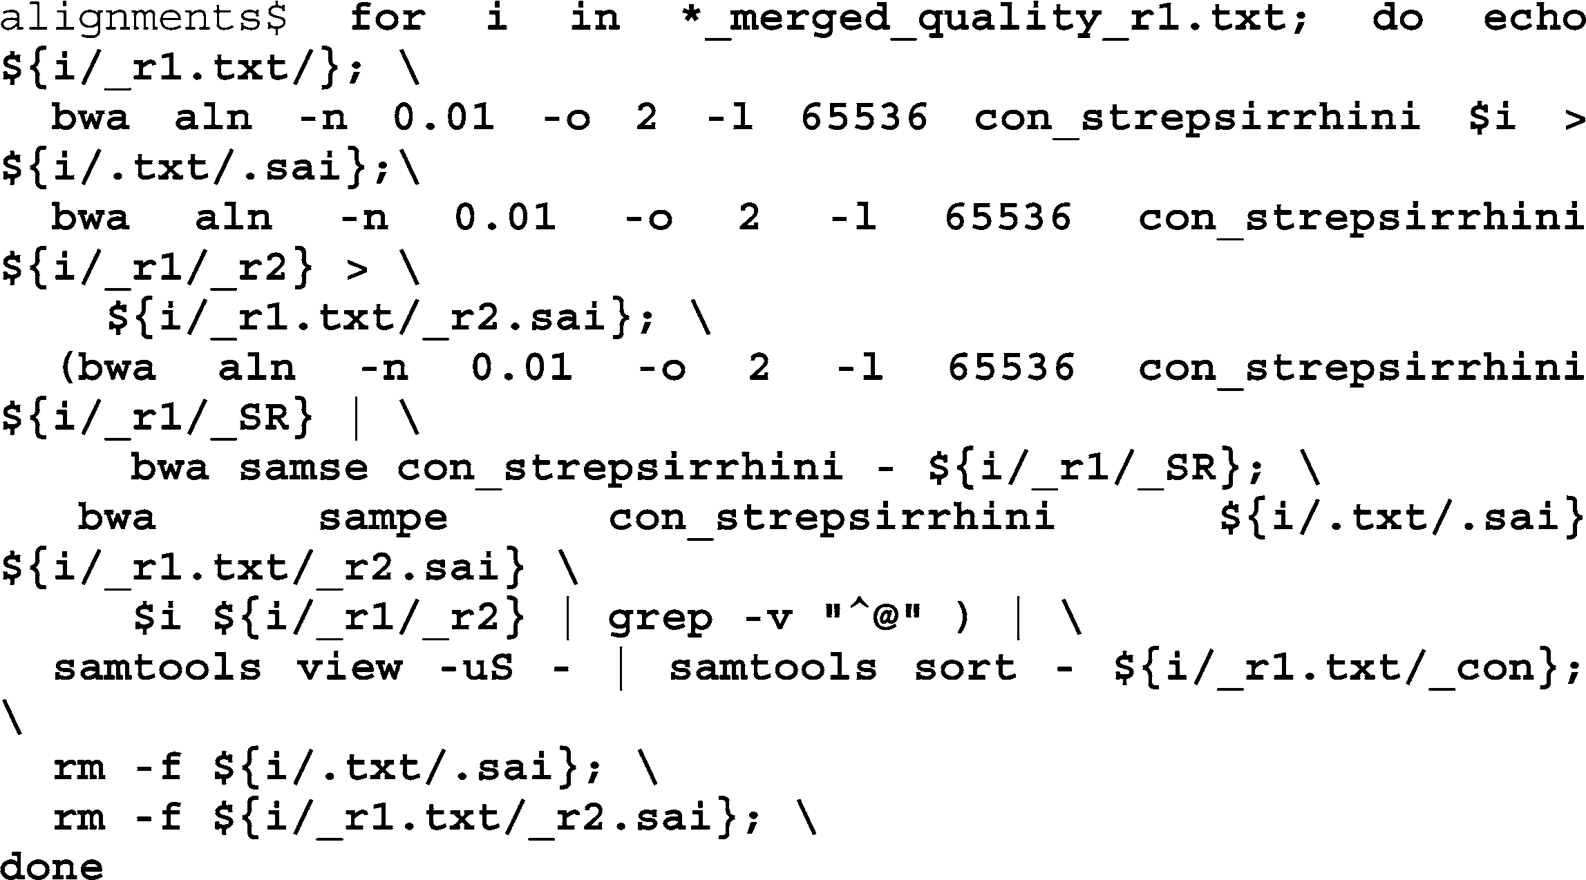
We will apply the latter approach to our mitochondrial data set. Use the revised Cambridge Reference Sequence (rCRS) of the human mitochondrial genome as a contaminant reference sequence, as the most likely source of contamination is people who may have handled the specimens. Add the rCRS to the set of strepsirrhine mitochondrial genomes, generating a new FASTA fi le containing all 15 genomes. Then generate the BWA index as described above for the new sequence set
con_strepsirrhini
, and repeat the alignment procedure: All reads that align to extended reference set of 15 sequences but that did not align to the original reference set of 14 sequences are counted as contaminants. In addition, all reads that score better (require fewer edits to match the reference) in the alignment to the extended reference set are considered contaminants. The ContTestBWA script evaluates the number of alignments reported for each read and the number of edits reported for both reference


23 Analysis of High-Throughput Ancient DNA Sequencing Data 219
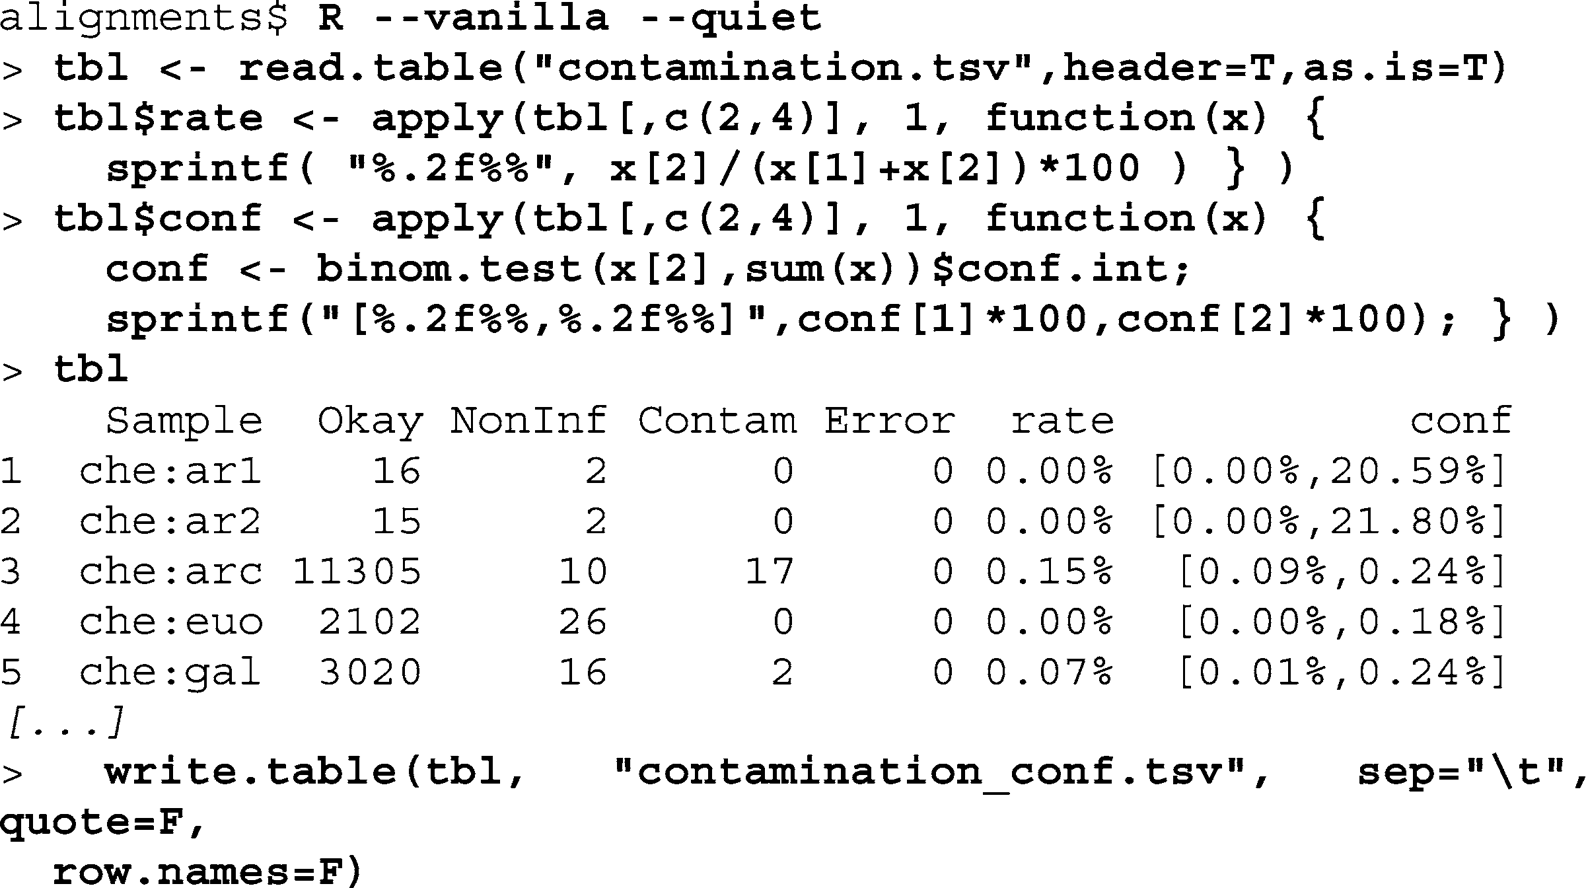
sets, and returns the number of good, noninformative, and contaminant reads. Assuming a binomial distribution, confi dence levels can be calculated in R.
Iterate over the output fi les for both alignments and direct them to ContTestBWA in SAM format (calling samtools view). The o parameter to ContTestBWA defi nes an output text fi le
contamination.tsv
to which the result is appended; the
n
parameter determines the name printed in the fi rst column of the output fi le:
Print the fi rst lines of
contamination.tsv
to screen. The result will look similar to this:
Call R, read in
contamination.tsv
, and name the resulting R
data structure
tbl
. Add the contamination ratio as well as the confi dence interval as columns
rate
and
conf
to
tbl
. Print
tbl
on screen and write to
contamination_conf.tsv
:
220
M. Kircher
The contamination point estimates range from 0.00 to 62.50%.
As the data come from six modern specimens, fi ve ancient specimens, and one museum specimen, we can calculate the proportion of contaminant sequences by sample type. All modern specimens and the museum specimen show at most 0.5% contamination. Two ancient specimens have contamination levels less than 1%. Three ancient specimen, however, contain between 8 and 13% contaminant sequences.
3.7. Handling PCR
Because most aDNA extracts contain very little endogenous DNA,
Duplicates
PCR amplifi cation is often unavoidable in HTS experiments. This may lead to problems in downstream applications, as nonrandom amplifi cation from only few starting template molecules may limit the capacity to identify polymorphisms (or damage) by altering their frequency in the sequenced sample. In the worst case, this problem can lead to incorrect consensus sequence calls or false estimates of the proportion of particular sequences at polymorphic sites. The best way to deal with this problem is to identify and remove duplicate sequences that are the result of PCR amplifi cation.
Independent molecules are frequently identifi ed based on their outer alignment coordinates
( 8, 54,
61
)
; however, sequence-based appr
oaches such as clustering ( 64, 65
) may also be used. When PCR duplicates of the same molecule have been identifi ed (a cluster), either a representative sequence is chosen or a consensus is determined. If a representative sequence is selected, that sequence should have the lowest probability of sequencing error, i.e., the highest sum of quality scores. Both the samtools
( 61 )
and GATK
( 54 )
packages implement routines for this type of fi ltering. A consensus sequence, which may reduce sequencing error considerably
( 27 )
, should only be calculated if the duplicate sequences are very unlikely to originate from different molecules (see Note 12). A script for calculating the consensus sequence from alignments in SAM format (FilterUniqueSAMCons.py) is available fr
om http://
bioinf.eva.mpg.de/fastqProcessing/
.
Identifying PCR duplicates in either the whole library or in the alignable fraction of the data may also be of interest for determining library complexity, i.e., the total number of different molecules in that library. The number of unique molecules (
u
) and the number of sampled molecules (
s
) can be used to estimate the total number of different sequences (
M
) (assuming sampling with
replacement, one can fi t subsampled values to
u
= 0 +
M
·(1 − e −
s/M
)).
Such complexity estimates are of interest when determining the fraction of a library that has been sequenced.
For the example data set, we will use a clustering algorithm called cdhit to determine how much of the library has been sampled. This algorithm has been optimized for use with the type and
quantity of data typical for 454/Roche ( 66 )
. Cdhit clusters all